There are some scenes only street-view imagery can capture. These researchers are using Mosaic imagery from Hurricane Ian to train GeoAI models to identify post-disaster damage levels.
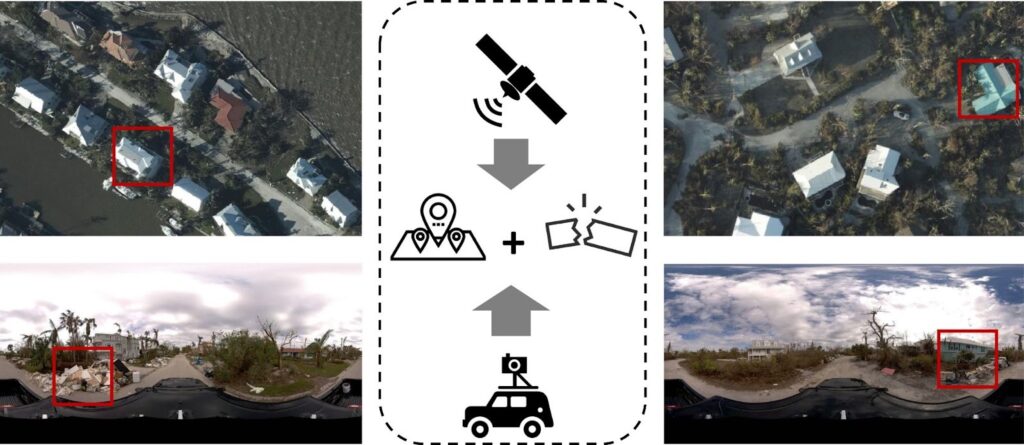
When Hurricane Ian struck Florida in 2022, it left behind not only physical devastation but also a difficult technical problem. From the air, you can see collapsed roofs, washed-out roads, and standing water, but not much else. On the ground, the full story emerges: ruined furniture piled at the curb, downed power lines, and damaged road signs that are often too small to visualize in overhead satellite pixels.
Bringing those two perspectives together is exactly what a group of researchers set out to do in their academic article: Cross-view geolocalization and disaster mapping with street-view and VHR satellite imagery: A case study of Hurricane IAN
Cross-view geolocalization combines street-view imagery with aerial or satellite imagery to accurately identify a position or location. Essentially, you are capturing imagery of the same locations but from different perspectives. When you add the location to these images, you’re able to create a digital environment that reflects reality on the ground.
Their framework, called CVDisaster (for “Cross-View Disaster”), is designed to answer two questions that they argue are usually the most important and difficult to gather after a disaster strikes:
- “Disaster damage perception,” or how badly people think urban infrastructure has been damaged, and
- “Geolocation awareness,” meaning where people and observations are located on the map.
To tackle both, the team combined high-resolution aerial imagery from the National Oceanic and Atmospheric Administration with post-disaster street-level imagery captured by Site Tour 360 using the Mosaic 51 and uploaded to Mapillary.
As the academic article describes it,
“These images (mainly panoramic images) were captured by Site Tour 360 with the help of Mosaic 360° Camera Systems after access was restored post-disaster, which are proved to be extremely useful for damage assessments, evaluating infrastructure durability, and planning recovery efforts.”
An open source collaboration
We got the chance to interview some members of the research and writing team from this project. Dr. Hao Li, currently a lecturer in the Department of Geography at the National University of Singapore (NUS), was the main author. Two doctoral students who were also on the project joined our call: Fabian Deuser, from the University of the Bundeswehr Munich, and Wenping Yin, from the China University of Mining and Technology (CUMT), who is jointly training with the Technical University of Munich (TUM).
In our call, Dr. Li described how the project began with publicly available imagery from the state of Florida.
“We were first looking at Hurricane Ian, because the state of Florida had actually open-sourced some very high-resolution aerial images captured after the disaster. We already had this aerial view, and I was looking around to see whether we could get some ground-level street view data to complement it.”
That search led him to a Mapillary blog post, Street-Level Imagery for Disaster Mapping and Relief, which showcased Site Tour 360’s post-hurricane mapping campaign with Mosaic cameras.
In the blog post, it was mentioned that,
“They [Site Tour] believe in open data, knowing that, following a disaster, the more eyes that are viewing the imagery, the better the chance of finding those in need and providing assistance. …Over the past few years, Site Tour has developed its techniques for planning, capturing, processing, uploading, and viewing of large-scale 360° imagery sets such that the imagery is available within 24 to 36 hours of capture. Mapillary is one more tool that Site Tour utilizes to make imagery widely available to a broad audience in a timely fashion – doing so is critical for making post-disaster imagery available for organizations involved in the response.”
An idea followed quickly for the research team:
If street view and remote sensing imagery were both free and open, why not combine them into a single cross-view dataset and see how far modern GeoAI models could go?
CVIAN: the aerial and street-view dataset from Hurricane Ian
After experimenting and setting up a framework, the research team developed CVIAN (for “Cross-View Ian”). This first-of-its-kind open dataset paired post-disaster NOAA aerial tiles with Mapillary street-view images captured with a Mosaic 51.
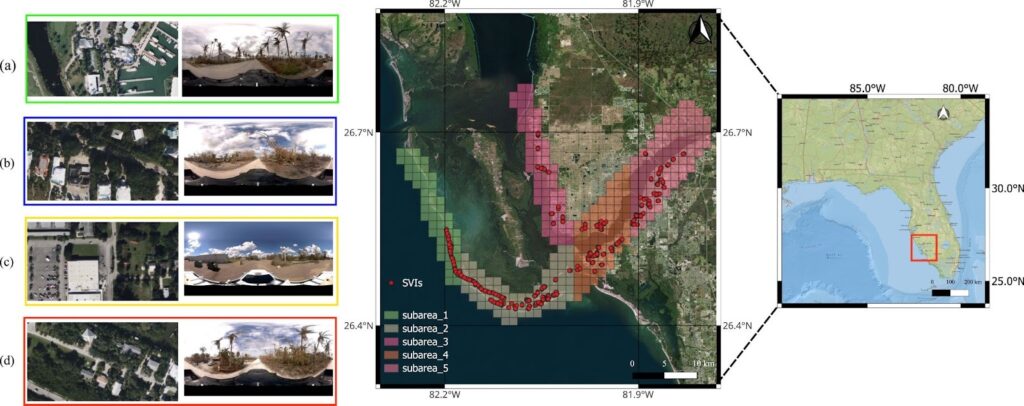
The imagery for CVIAN came from Sanibel Island, Florida, and the surrounding area after Hurricane Ian struck in September 2022. The team processed and filtered 957,539 SVI records from Mapillary and selected 4,121 images.
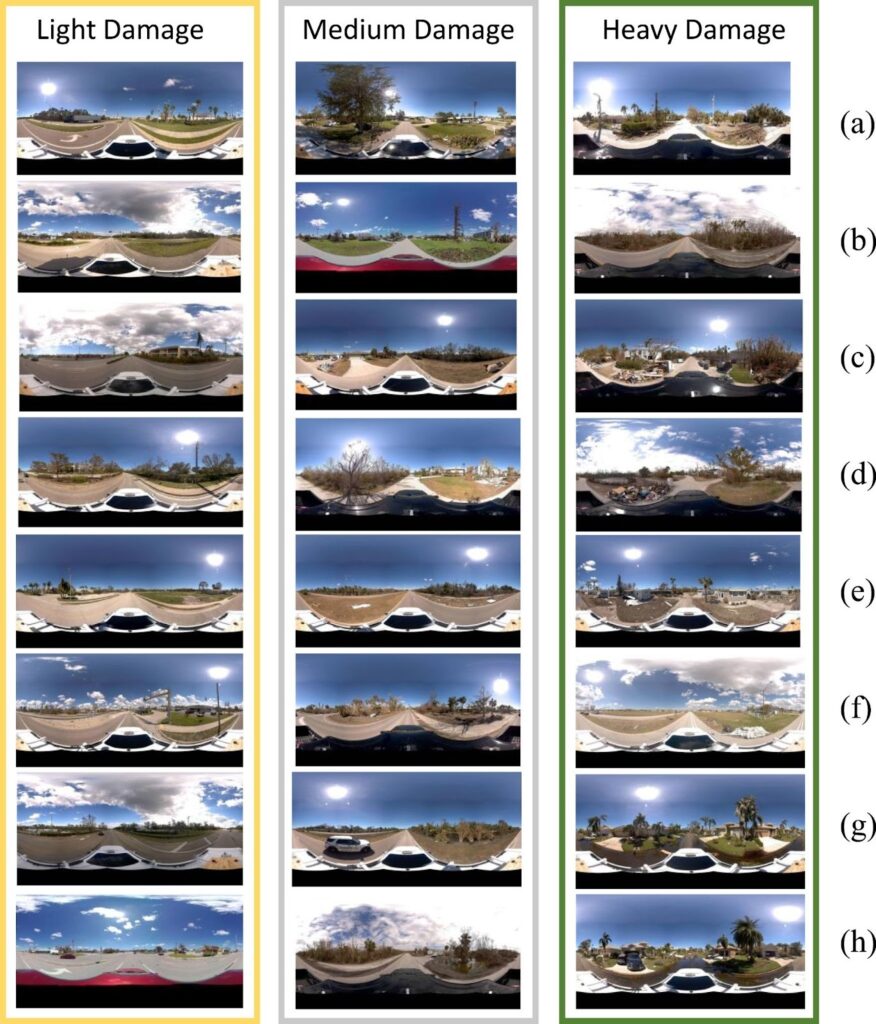
The research team then manually categorized the images into three levels based on the severity of the hurricane damage. Images were given a score of light, medium, or heavy, based on the following criteria:
- Light damage: “a clean scene with no significant or only light damage, such as small areas of fallen trees or a few small road signs knocked down.”
- Medium damage: “relatively cluttered and typically include larger or more extensive areas of fallen trees and standing water around the trees. These images may also show more fallen road signs or road closure signs.”
- Heavy damage: “chaotic, featuring large or extensive areas of fallen trees, flooded roads, and housing trash.”
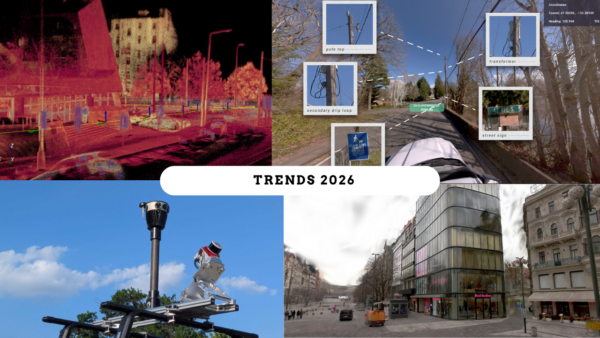
The images were then further categorized by damage type. As you can see in the image below, damage perception was divided into the following:
- Rows (a) and (b): fallen trees
- Rows (c) and (d): housing trash
- Rows (e) and (f): street signs or destroyed buildings
- Rows (g) and (h): standing water in the street
A job only street-view imagery can do
During the discussion, Dr. Li gave a concrete example of what only street-level imagery can reveal.
After Hurricane Ian, many families whose homes had been flooded cleaned up abandoned furniture and ruined belongings by putting them in front of their doors. Those piles of trash became a subtle but important indicator of flood damage, even when a building looked structurally intact from above.
“From above, you actually do not really see these kinds of structural damage, such as flooding. That is exactly why we need the street view imagery when we try to see the damage. There is some damage you simply do not see from the NOAA aerial view.”
This insight aligns with the academic paper’s broader motivation. The authors argue that satellite imagery alone struggles to capture nuanced human perceptions of damage, while GPS-based positioning can fail under challenging urban and weather conditions. Cross-view methods that fuse satellite and street view imagery provide a promising alternative.
CVDisaster
CVDisaster is the GeoAI framework that should answer the two main questions after a disaster strikes: how badly the urban infrastructure is damaged, and where the damage occurred.
It consists of two models working on the same cross-view pairs:
- CVDisaster-Geoloc is a Siamese ConvNeXt-based network trained with a contrastive objective to match street view images to the correct satellite tile.
- CVDisaster-Est uses a dual-branch Vision Transformer (CGCViT) to classify each cross-view pair into the three damage levels.
The results are impressive for a first attempt. On the CVIAN dataset, the team reports that “CVDisaster can achieve highly competitive performance (over 80% for geolocalization and 75% for damage perception estimation) with even limited fine-tuning efforts.”
Supporting open source disaster research
This work is only one part of a growing ecosystem of open geospatial data for disasters. In the spirit of keeping this valuable knowledge open-source, the research team made the data and code for CVDisaster available on GitHub for anyone in the geospatial community.
Perishable data and Mosaic imagery
To make the data truly useful, Dylan Faraone and Mike Vorce, who collected the street-view imagery for Site Tour 360, also built a lightweight web viewer. It aligns their ground-level panoramas with NOAA aerial imagery and Google Maps. They developed the tool to quickly deploy data to disaster response teams so they could see the before-and-after views side by side.
For PhD student Fabian Deuser, the web viewer’s value was clear:
“This is perfect, because in most cases for disaster recognition, we only have satellite images of the disaster location. With this, we can learn from non-destructive data and see how it generalizes to the disaster case.”
Post-disaster data for insurance claims
Another important use for post-disaster data is for insurance claims processing. In these cases, post-disaster imagery helps verify claims and release funds to homeowners and businesses.
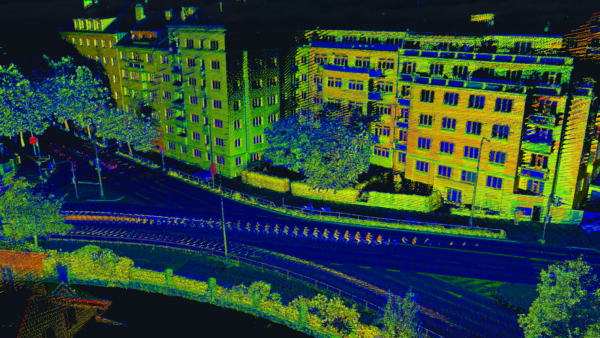
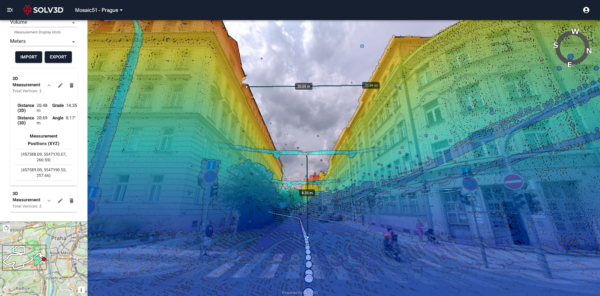
REALMAP Prague
Another wealth of open-source street-view imagery is the Prague REALMAP. This large-scale data capture project is the combined efforts of years of testing Mosaic products on the streets of Prague.
The dataset features 15.15 terapixels of high-resolution data, comprising 210,469 panoramas at 13.5K resolution, generated from 1,262,814 source images (6 x 12MP per panorama). To give back to the academic and experimental communities, we made this dataset available for free, non-commercial use.
Read more about the Prague REALMAP here.
Conclusion
CVDisaster is still a research prototype, and the authors are clear about its limitations and future work, from handling rapid temporal changes to extending the approach to other disaster types worldwide.
For us at Mosaic, this collaboration shows what industry and academia can do when open data, robust hardware, and creative research come together. A camera on a truck or a boat in the days after a hurricane becomes more than a record of damage. In the hands of capable researchers, it becomes training data for algorithms that can help responders understand where people are, how badly they have been affected, and where to go first.
Dive into the full open-access academic article here. Once you’ve finished reading, go follow Mosaic on LinkedIn to keep up-to-date on happenings in the world of geospatial imaging.