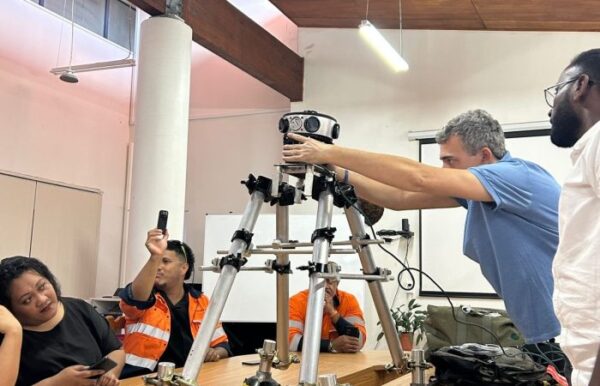
Researchers at Texas A&M are using Mosaic-captured imagery to develop disaster resilience frameworks that bridge the gap between satellite data and ground truth
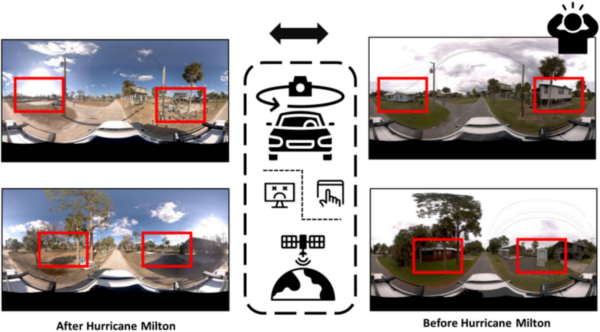
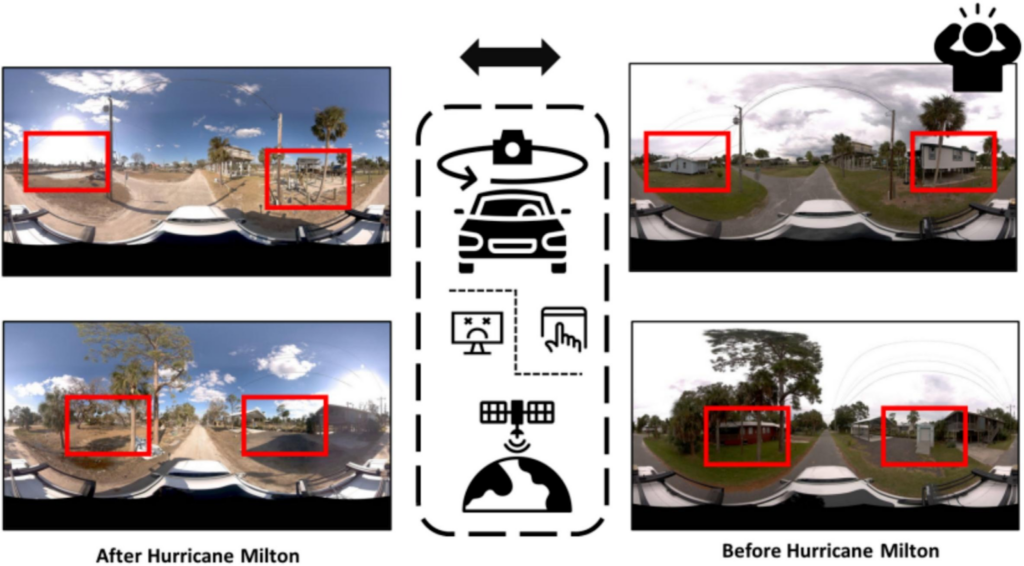
When Hurricane Milton swept through Florida in October 2024, it left behind damage that traditional aerial imaging struggles to interpret. Among the damage were piles of displaced furniture, compromised doors and windows, scattered debris, and structural vulnerabilities visible only from street level. This exposed multiple limitations in disaster damage assessment. While satellite imagery excels at quickly capturing large-scale impacts, it misses the human-scale details.
For researchers at Texas A&M University’s Department of Geography, this represented both a challenge and an opportunity. Led by PhD student Yifan Yang and Dr. Lei Zou, their research group has spent years working at the intersection of spatial data science, GeoAI, and disaster resilience.
Their pursuit of more accurate damage assessment methods is reshaping how we think about the infrastructure requirements for disaster response, insurance risk modeling, and the democratization of high-quality geospatial data.
Thanks to image data captured with Mosaic mobile mapping systems, their team is designing a rapid, hyperlocal damage assessment tool:
“This research focuses on hyperlocal disaster damage assessment by leveraging paired pre-disaster and post-disaster street-view imagery. By explicitly incorporating bi-temporal ground-level visual information, the study aims to improve the accuracy and reliability of disaster damage assessment at a fine spatial scale.”
-Yifan Yang
The research gap? A resolution gap
Traditional disaster damage assessment protocols have long relied on remote sensing platforms (primarily satellite and aerial imagery) to capture post-event impacts. These datasets offer undeniable advantages: rapid acquisition, broad geographic coverage, and they can capture conditions in unsafe areas on the ground. Federal agencies and commercial providers have both invested heavily in this technology.
Yet blind spots persist. As Dr. Zou explained,
“When we look at street-level, we see how people throw out all of the wasted furniture, and the damaged building facades, doors, and windows. Not to mention the high-water mark on buildings. It can only be observed from a human perspective rather than from the sky.”
-Dr. Lei Zou
The research team’s analysis of Hurricane Milton’s damage revealed cases where satellite imagery indicated minimal structural impact, but the ground-level imagery showed buildings damaged beyond repair. Without baseline pre-disaster imagery from equivalent perspectives, assessors would have assumed no damage occurred. This systematic underestimation of disaster impacts has direct consequences for resource allocation, insurance claim processing, and long-term recovery planning.
“Traditional public remote sensing datasets, such as Landsat or Sentinel, suffer from clear limitations in spatial resolution and visual detail. More importantly, they lack a ground-level perspective that is closer to human visual perception. These limitations motivated me to seek out street-view imagery as a complementary and, in many cases, indispensable data source for disaster assessment research.”
-Yang
Finding pre- and post-disaster image pairs
One of the most persistent challenges in ground-level disaster assessment is the acquisition of temporally (or time)-matched image pairs. These are datasets captured from the same location and perspective, both before and after an event.
The problem extends beyond simple data availability. Commercial street view providers like Google typically update their coverage on multi-year cycles, with urban areas receiving more frequent attention than the coastal and rural communities, often most vulnerable to natural hazards. Even when pre-disaster imagery exists, inconsistencies in camera systems, capture angles, and image processing can complicate automated analyses.
Mosaic image data to the rescue
This is where the Texas A&M team made a discovery. Site Tour 360 had captured imagery of damage from Hurricane Milton using Mosaic 360° cameras and published it to Mapillary. They provided exactly the type of high-quality, temporally-aligned dataset the Texas A&M team required.
“In this study, Mosaic data plays a critical role by providing high-quality pre-disaster and post-disaster street-view imagery.
While street-view imagery itself is not scarce, datasets that are consistent in format, high in visual quality, temporally aligned, and disaster-related remain extremely limited. The value of the data lies not merely in availability, but in its reliability, consistency, and suitability for longitudinal analysis.
From a research perspective, data is the starting point of everything. Compared to algorithmic sophistication, a well-constructed and high-quality dataset is often far more decisive in determining the ceiling of achievable research outcomes. Mosaic data provided a solid and dependable foundation upon which the entire analytical pipeline was built.”
-Yang
High-quality imagery as the basis of good research
For researchers, data quality is a major determining factor in whether a research question can be meaningfully addressed. Texas A&M’s team assessment of Mosaic data reveals why certain technical specifications matter in practice.
360° panoramic coverage
Unlike traditional forward-facing street view systems or building-centric documentation, Mosaic’s full spherical imaging captures environmental context that would otherwise be lost. This comprehensive perspective proved essential for documenting debris fields, damaged vegetation, and infrastructure impacts that extend beyond building facades.
High resolution
The level of detail captured by Mosaic systems showed fine-grained damage indicators. These included compromised roofs, broken windows, and structural deformation patterns that inform damage classification schemas. This resolution exceeds what most public datasets provide.
Format consistency
Perhaps most critically for AI and machine learning applications, Mosaic data maintains consistent formatting. When pre-disaster and post-disaster imagery differ in format, perspective, or acquisition conditions, this inconsistency can directly affect the performance and reliability of computer vision-based analysis.
Spatial accuracy and georeferencing
Precise geolocation enables temporal alignment and integration with other geospatial datasets, so the research workflow depends on matching imagery to specific locations. This is especially true for comparing pre- and post-disaster conditions at the same coordinate positions.
Adequate Coverage Density
While single-pass coverage might suffice for visualization, research applications often require multiple perspectives of the same features. The dataset’s density enabled robust statistical analysis and model validation. These millions of images covered affected areas with high enough density for machine learning.
Licensing Clarity
Academic researchers operate under institutional review boards and publication requirements that demand clear data provenance and usage rights. Ambiguous licensing creates institutional barriers that can be difficult to overcome, even when data is technically accessible.
Mosaic’s systems address all of these requirements. High-precision GNSS/INS positioning, automated metadata capture, and standardized output formats align with research needs without requiring custom workflows.
The published results
The Texas A&M team’s research was published in the October 2025 volume of Computers, Environment and Urban Systems: “Hyperlocal Disaster Damage Assessment Using Bi-temporal Street-View Imagery and Pre-trained Vision Models.”
It demonstrates a workflow that bridges research and practical application. Their approach combines:
- Temporal image pair identification using geographic coordinates and timestamp metadata
- Pre-trained vision model adaptation for damage classification tasks
- Multi-class damage assessment that distinguishes between structural, environmental, and infrastructure impacts
- Validation against ground-truth field surveys and insurance claims data
The implications of their research extend well beyond hurricane response. Their research group has expanded to wildfire spread prediction, flood impact assessment, and drought monitoring. They also have two additional manuscripts currently under review. All of which leverage ground-level imagery to provide context that satellite data cannot.
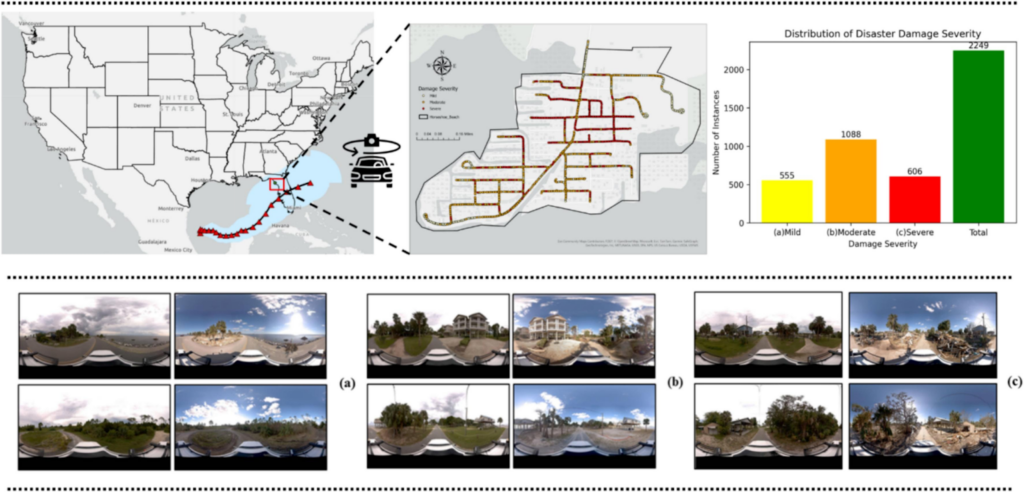
They are working toward an AI agent for disaster resilience management. It would be capable of ingesting multiple data modalities and producing actionable intelligence for diverse hazard types. Below you can see an example of this from three different damage levels (mild, moderate, and severe).
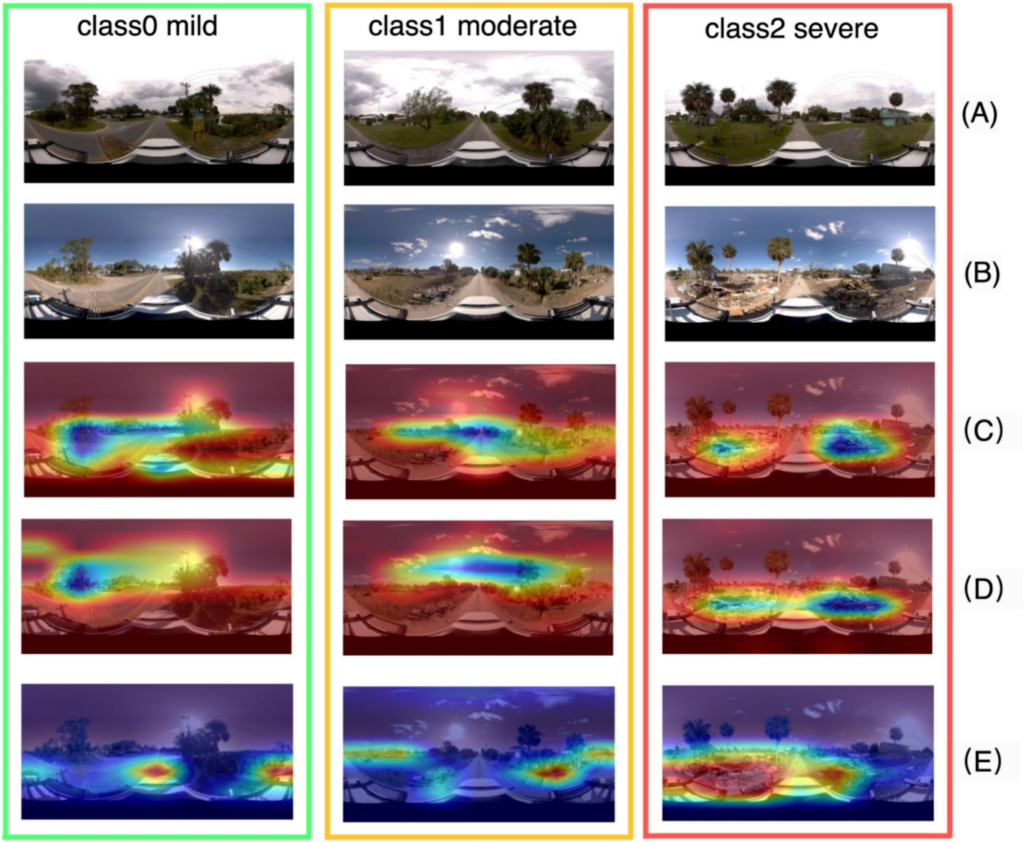
Panel (A) shows pre-disaster imagery, Panel (B) shows post-disaster imagery, and “Panels (C) – (E) display the Grad-CAM visualizations for the model fine-tuned on post-disaster images, the model fine-tuned by a mixed dataset (both pre- and post-disaster images), and a dual-channel model fine-tuned by pairwise pre- and post-disaster images.”
GitHub resources
Below, the team has open-sourced the datasets and code associated with three studies on GitHub. Another ongoing project is focused on satellite-to-street-view generation for disaster scenarios.
The related repositories include:
Why academic access matters
A consistent theme emerges when we talk to scientists, and that is the academic community’s need for high-quality, openly accessible street view datasets. When Site Tour 360 published millions of disaster-related images to Mapillary, they effectively democratized access to a dataset that would have required substantial grant funding to collect independently.
“Based on my experimental results, Mosaic data demonstrated strong performance in terms of spatial resolution, visual consistency, and overall usability, making it highly suitable for my research objectives.”
-Yang
The data gap between aerial and street-level mapping
Federal programs like the United States’ Landsat and the European Space Agency’s Copernicus initiative have provided free, open satellite imagery for decades. Street view imagery, however, remains largely proprietary. Its coverage is usually concentrated in commercially viable areas determined by business priorities rather than scientific needs.
Prague REALMAP: free, open source street-view data for researchers
One of Mosaic’s initiatives for researchers is the free Prague REALMAP dataset of street-view imagery. It is available with the Creative Commons Attribution-Non-Commercial license. Under this license, the REALMAP dataset is for researchers and students to test theories, do photogrammetry, 3D reconstructions, and more, within non-commercial use. The images are precisely positioned (usually with around 2cm accuracy), and maintain an accuracy of 10-20cm, even in GPS-denied environments. The full dataset includes:
- 210,469 panoramas in 13.5 K resolution
- 1,262,814 source images (6 x 12MP per panorama)
- 15.15 terapixels
- 1 image every meter along every track
- GDPR-compliant anonymization of faces and license plates
Learn more about Prague REALMAP in our official announcement: The Mosaic Prague REALMAP is here!
Conclusion
As climate change intensifies disaster frequency and severity, the need for effective damage assessment tools grows more urgent. Traditional approaches, like manual field surveys and satellite analysis, remain essential but insufficient. However, ground-level imagery provides the human-scale perspective that determines recovery outcomes.