5 Real-time HD Mapping Advances for Better Routing in Logistics
Why logistics routing might be one of the biggest industries affecting everyone on this planet
Logistics companies lose out on billions of dollars annually, as reported by Mapillary’s internal investigation. With better maps, drivers spend less time taking the wrong turn, looking for the proper entrance, waiting for the proper drop-off/pick-up window, and much more.
Everyone likes big numbers, right? Let’s start with these:
The global logistics market size in 2018 was 6.6 trillion USD or 5.5 trillion euros. Some research even has that number at 9.6 trillion USD.

Road freight accounts for the largest segment of this market at 2.15 trillion USD or 1.8 trillion euros.
The Asia Pacific region ranks as number 1 of the overall global market value at 2.4 trillion euros, and North America trails behind in second place with ‘only’ 1.4 trillion euros of the market share.
That was in 2018. Just one year later, the Asia Pacific region had increased its market value to 3.2 trillion euros.
Why you should care about logistics routing and planning
The freight trucking industry is the most common source of moving products from point A to point B. From the plant or the orchard, to the factory, to the warehouse, to the showroom, and finally to your house. Nearly everything you own, touch, and consume requires some form of assistance from a truck or other freight transportation vehicle.
Some more numbers to consider:
The U.S. Bureau of Transportation Statistics found that the value of goods being handled by truck freight in the US increased from nearly 10.9 trillion USD in 2012 to 11.5 trillion USD in 2018. That number is expected to grow to 18.6 trillion USD by 2045.
As noted below in yellow, freight trucks are the #1 mover of the top 10 commodities by weight and value.
.")
Real-world impacts of (non)efficient route planning
“The times they are a changin” Bob Dylan once predicted. Times are always changing, but we have seen the incredible speed at which this happens over the last decade. The increase of smartphones, advancements in IoT, and the daily habits of humans across the world are changing. The COVID crisis only helped to accelerate the pace of change in our daily lives.
Rather than going to the supermarket once or twice a week, many have opted for ordering online groceries. Rather than heading out for dates on the weekend with friends, couples are ordering in food from their favorite restaurants. And rather than browsing the malls, consumers are choosing to shop online and have everything delivered directly to their homes.
Statista found that in 2018, the United States had nearly 260 million online shoppers. In 2020, the number was 256 million, and that is considering there was a global pandemic. They project that by 2024, that number will increase to nearly 280 million. At the same time, Digital Commerce 360 reports that actual sales increased drastically. Total e-commerce sales in the US went from $598 billion in 2019 to a staggering $861 billion in 2020. That’s a 44% increase! Total retail sales also increased, but only by 6.9%. The e-commerce sales represent 21.3% of total retail sales in 2020, compared to only 15.8% in 2019.
So why am I telling you all this?
So that you understand the economic and financial gains and losses that are at stake here for retail companies, online delivery services, and, of course, some of the biggest players in the game: Amazon, Walmart, and Best Buy.
These behemoths are utterly dependent on trucks, truckers, and logistics routing to deliver all of these precious goods on time, to the correct destination, and at the most efficient cost.

Mapillary, a Mosaic customer, in partnership with Dimensional Research, conducted an incredible survey of hundreds of last-minute delivery drivers. They wanted to find out how and where their logistics routing is most affected. For a complete breakdown of their findings, check out their full report here.
Who’s affected?
- 12% of drivers surveyed have problems with each delivery
- 33% of drivers have problems on a daily basis
- 99% of drivers responded that a better map for route planning would increase their efficiency
What are the problems drivers are facing with current logistic routing methods?
- Time was lost because the route planner took them to the wrong address.
- 75% of drivers reported that they regularly lose more than 15 minutes a day going to the wrong address
- 33% say they lose on average, 30 minutes on a typical day, and up to 180 minutes on other days
- Extra wear and tear on the vehicles
- Total mileage increases by 10 miles a day for 50% of drivers
- Mileage increased by 25 extra miles/day for 11% of drivers
- Time lost at the delivery point due to a lack of details in the maps
- 72% of drivers reported spending 4 minutes identifying the correct building number and entrance
- That’s 7 million minutes (13 years) wasted every single day
- Calculating the correct drop-off window due to out-of-date maps
- 96% arrive early and have to wait around for the scheduled delivery time
- 62% have to wait less than 30 minutes: 26% wait 30-60 minutes, and 9% more than an hour
- Lack of information regarding parking leading to a loss of time
- 55% of drivers spend 2-6 minutes per delivery looking for parking
- 32% spend more than 7 minutes per delivery
- More than 50% of drivers reported that in the past month, they spent more than 20 minutes looking for parking
- 57% of drivers reported getting several parking tickets per month
- Other issues drivers face are due to poor, outdated, inaccurate, and ineffective maps. In all cases, these incidents were more common for businesses than for residential.
- 44% of drivers have experience in which the recommended routes were not the shortest or fastest route
- 43% experienced being sent to a location far from the actual drop-off point
- 33% said the maps weren’t aware of road closures
- 26% reported that maps are not updated with one-way streets, turn lanes, or new exits

Case in point:
I have a brother who lives in a rural town in California. He has a P.O. Box for receiving letters, but packages are delivered to his house. However, for the past few years, every time I attempt to send my niece and nephews a Christmas or birthday present, it gets marked as ‘impossible to ship to this address’ or gets returned to the vendor and requires several tries to finally get it delivered.
Even combining both addresses can be a problem. Amazon wouldn’t let me put the lines in the correct order for the most recent purchase, and I’m left wondering if it will arrive as scheduled.
And despite the fact that his street’s name ends with an ‘o’ as is evident from Google Street View, Google Maps has it spelled with an ‘a’. Even Google fails.
What’s at stake because of poor logistical maps and route planning?
Money, lots and lots of money. Money makes the world go round, but lost or poorly invested money makes things go so much worse. Route planning for logistics currently sucks up a LOT of money.
(The following are cost estimates from Mapillary’s research)
- $2.5 billion in losses annually on wages
- $611 million/ year for extra gas and fuel spent due to the extra miles driven
- $545 million /year is lost while drivers look for building numbers and entrances
- $2.5 billion annual revenue due to drivers arriving ahead of the delivery window
- Parking ticket losses were not calculated, but one can assume it was in the low millions
- While not calculated, the additional time spent driving miles that were not necessary and idling while waiting for the delivery window will certainly add wear and tear on the trucks
And it’s not just money that is at stake. The physical and mental well-being of the drivers and the vehicles they are traveling in, the end recipient of the packages, and the environment can all benefit from more effective maps to plan logistics routing.
What are the potential gains of better logistics maps?
As we saw, staying on time and on schedule, of course, means saving money, but let’s discuss some other improvements and benefits from creating better logistics route planning maps.
- On-time deliveries mean that the following deliveries go smoothly for the driver
- The chances of accidents decrease as drivers are not in a hurry
- Traffic tickets decrease (same as above)
- Fewer packages will be returned to the depot to be stored and delivered another day
- Recipients will be much happier, and customer satisfaction will increase if they can depend on their deliveries to arrive in the scheduled window
- The environment will also benefit greatly from well-planned and well-mapped routes to their destination. By cutting down on the routes that are unnecessarily long or require a driver to idle outside because he/she arrived too early, the current total (from 2018) of 429 million metric tonnes of CO2 equivalent will certainly decrease.
Requirements for a 360º HD, Real-Time Mapping Solution
Back to the original claim of this article:
Advances in HD mapping will significantly improve the quality of routing in logistics and the whole supply chain
The technology used for creating logistics routing maps may be beyond many of our imaginations, but in-house, made-to-order, and off-the-shelf solutions, mainly involving sensors, cameras, lenses, and extremely powerful computers, are at the forefront of these advances.
Here are 5 main requirements that must be met in order to offer logistics companies a solution that will save them time and money and bring about effective change in their business:
- Real-time updates with high-precision GPS for better logistics map calculation of travel time
Many of the technologies available are solutions that can easily and quickly gather data and update current road conditions, changes in lane direction, construction zones, and new or closed exits. Powered with this knowledge, those planning the truck’s route or the driver himself can choose a route that is both the quickest and the most economical to reach the final destination. They will also be able to plan alternative routes for any last-minute changes on the road, in real-time.
- LiDAR integration to understand the environment
LiDAR technology gathers incredibly detailed information about its surroundings, enabling users to see more than just the roads they travel on, but to understand what they are driving past. It can detect objects and help build a world in which the truck will be operating. Despite road signs, trucks get stuck under bridges and underpasses more often than you might think. With LiDAR technology in place, the height of such structures can be collected, measured, and processed for proper route planning for logistics. This technology will be even more paramount as autonomous vehicles transition to become our deliverymen.
- HD quality maps
Imagine having incredibly high-quality images of the streets, the buildings, and the entrances where trucks will be making deliveries. They will have access to maps created by 360º cameras, which are able to give 12K resolution, so that even the smallest detail, such as a sign hung at an entrance saying “Deliveries around back,” will be visible, and they can arrive knowing what awaits them.
- GIS capabilities
A geographical information system (GIS) is a method of surveying that combines various forms of data collected (usually on the road) and represents it in its geographical area. The multi-layered map allows us to see roads, topography, and road furniture such as street signs, benches, mailboxes, and traffic signs. This information can give freight truck drivers the data they need to anticipate possible obstacles along the way, such as knowing where they can or cannot park before arriving.
- 3D scanning capabilities
Having a 3D scan of the intended drop-off location can also be extremely beneficial for delivery truck drivers. With a visual aid to help them navigate the entrance and drop-off locations, they will have more confidence in what is awaiting them. Mobile mapping cameras with 3D scanning capabilities can allow for this information to be collected and turned into a valuable visual representation of buildings, roads, and street signs.
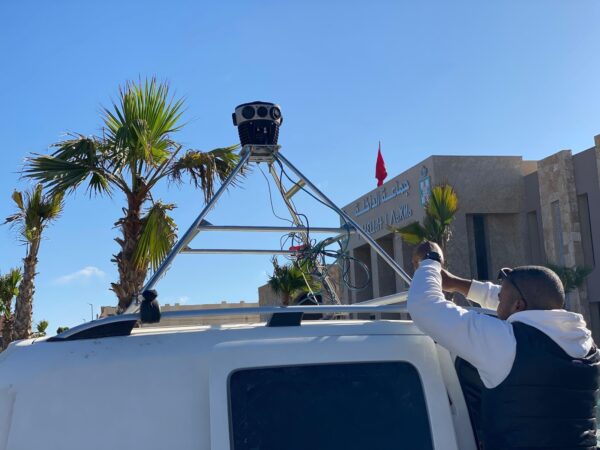
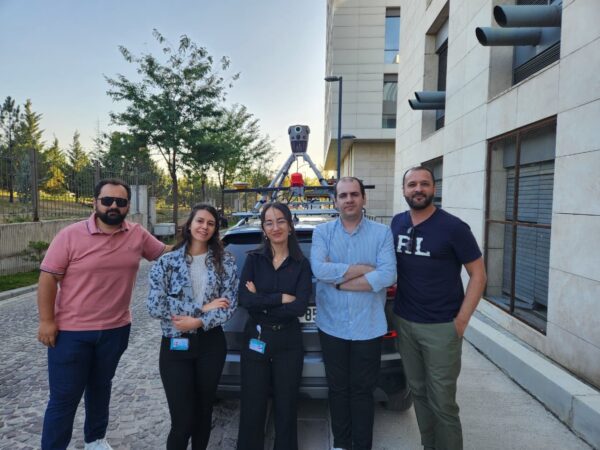
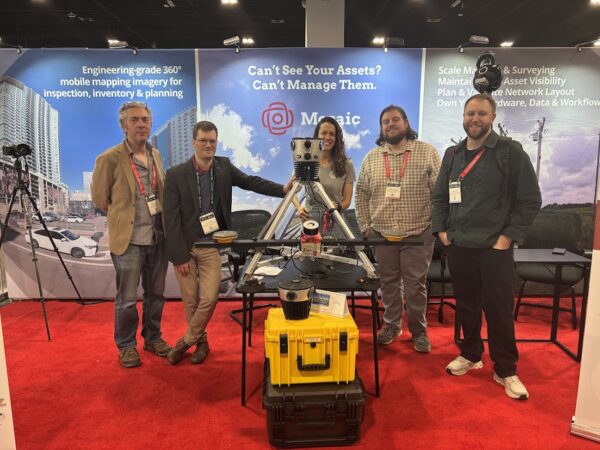
Why the Mosaic 51 is your solution for logistics routing and planning
The Mosaic 51 combines all of the necessary requirements into one incredible 360 mobile solution. Logistics companies will be able to collect data (internally or source from an external partner) and create maps that check off all of the boxes. With 12K resolution, LiDAR integration, and the ability to connect up to 4 GNSS networks simultaneously, the Mosaic 51 camera is helping logistics companies of all sizes and across all geographies to build better maps for smoother, cleaner supply chain distribution.
Contact the team at Mosaic for more information and to request details regarding the Mosaic 51. We have a solution that will meet your needs.