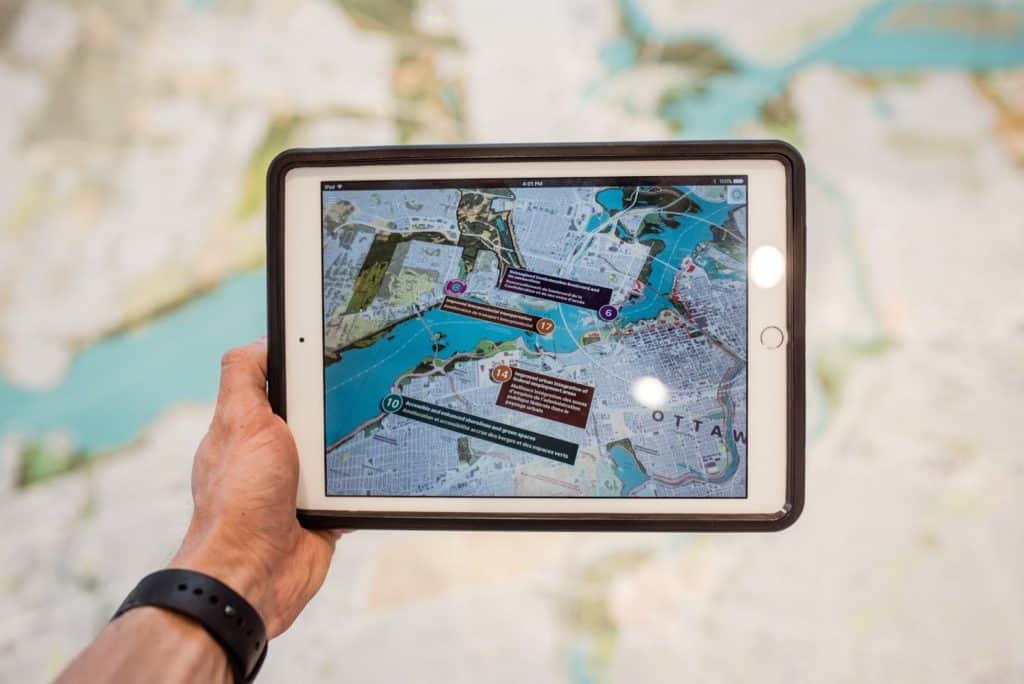
Mobile mapping has revolutionized the field of navigation over the past decade and is the future of cartography. It is a burgeoning industry that captures highly precise representations of our surroundings. These new technologies produce online dynamic maps with real-time information, up-to-date accessibility, and the potential for automated generation.
As the world becomes increasingly digitized and, therefore, in need of more smart maps, helping cities reduce their environmental impact is instrumental for better living. If you are curious about the sustainability of mobile mapping and how it can contribute to a greener future, read on.
What is mobile mapping?
Mobile mapping is the process of capturing geographic data with mobile devices. This happens through various methods, such as GPS, laser scanning, and digital photography. Once the data has been collected, it has many purposes, including navigation, urban planning, land surveying, agriculture inspection, and more.
It also makes it possible to conduct surveys in remote areas or where traditional methods are impossible or expensive. Synchronize data centrally either through direct transfer or via a remote server, then create your own database for further processing. Now, surveyors can better comprehend and visualize information through GIS software to make more informed decisions and foresee future challenges.
Due to its widespread use and availability, data collection may not seem like it has much to do with mapping, but in fact, various data collection methods benefit digital maps. Therefore, the way that we gather data hugely impacts the overall carbon footprint of the mapping process.
What is a carbon footprint?
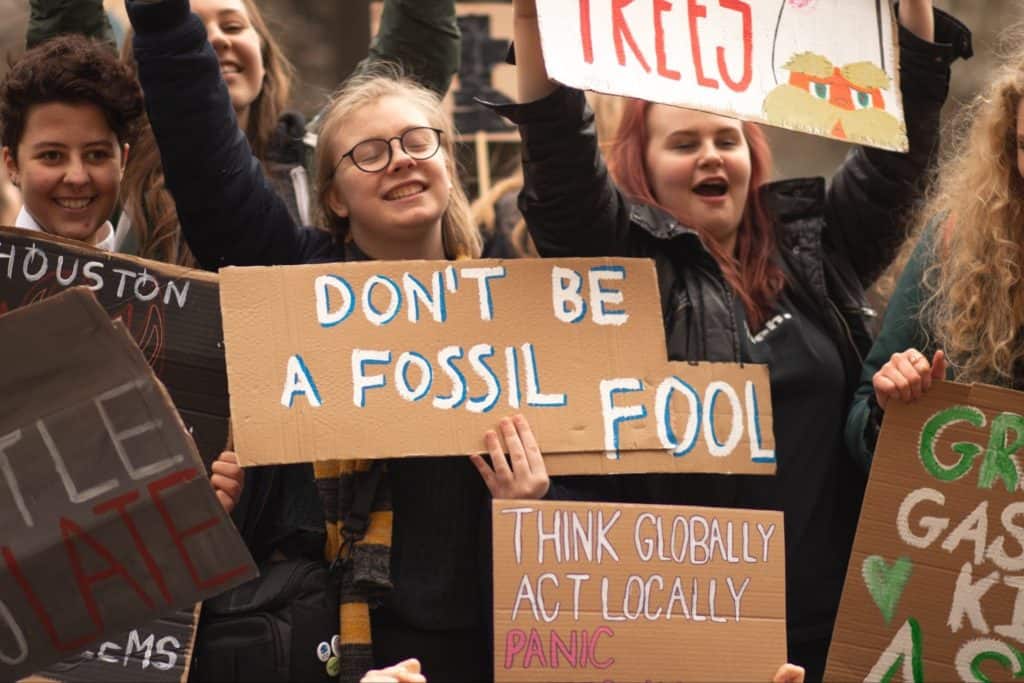
With the increase in climate change information and environmental activism over the last few years, sustainability has become a hot topic. But just in case you’ve been living under a rock, let’s cover the basics first. A carbon footprint measures an individual or organization’s impact on the environment based on greenhouse gas emissions. The phrase ‘carbon footprint’ arose to describe how much a person’s activities contribute to global warming. For example, if someone takes a train instead of flying, they would have a smaller carbon footprint. You can calculate your own contributions to emissions here and get a better understanding of it.
Today, mapping cities with GIS technology is the norm, but do we ever think about how that information gets there? What’s the carbon footprint of this process, and how can we do one better?
How we can reduce the carbon footprint of mapping
Mapping (traditional or digital) goes through three main stages: preparation, production, and distribution. Each of these requires a different timeline and level of resources, which makes a huge difference in the carbon footprint.
Roughly speaking, there are two main ways we could reduce the carbon footprint of map creation:
1. By making our mapping processes less resource-intensive
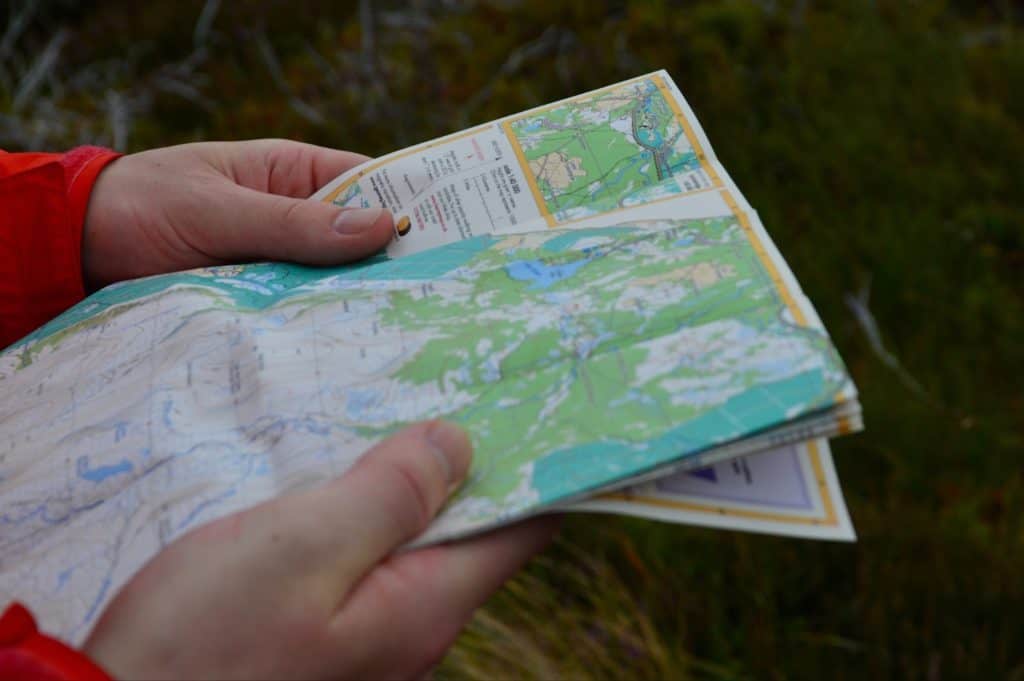
Traditional paper cartography requires a lot of paper and printer ink, requiring large amounts of non-renewable resources such as trees and petroleum. On top of that, the distribution of these maps alone requires the production and issuing of many copies over a large geographical area, which uses a lot of limited reserves as well. Reducing the number of paper maps produced or using paper maps made from recycled materials would be a good start.
2. By creating maps that use fewer non-renewable resources
This approach involves using low-impact mapping tools such as digital map data sources. These maps need less energy and materials to produce. These mapping practices are also faster, which conserves energy. Users can also save data digitally for reuse in future projects.
Why mobile mapping is the green way to go
As seen above, mobile mapping definitely allows us to collect data in a more efficient and environmentally friendly manner than traditional methods. Field data can be captured quickly and accurately with minimal impact on the landscape, and carbon emissions can also be reduced by streamlining the workflow of traditional mapping processes. In addition, there’s no interference with traffic conditions with mobile map creation, which means less pollution long-term, because of no backed-up traffic or stopped cars (which happens a lot with traditional data collection methods).
Carbon footprint in mobile mapping
Now that we know that by relying on digital tools instead of paper maps and field surveys, we can save significant amounts of energy and resources, let’s look at the carbon footprint of mobile mapping.
As different types of methods require different collection practices, the level of carbon footprint is affected accordingly.
There are three main types of mobile mapping methods:
1. Digital map data collectors
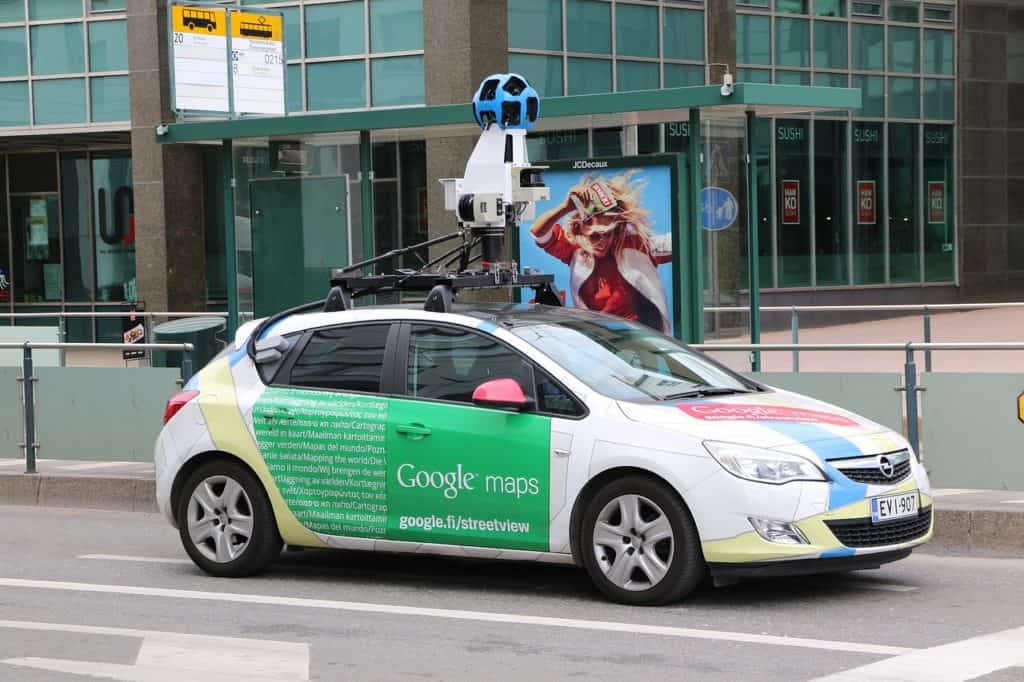
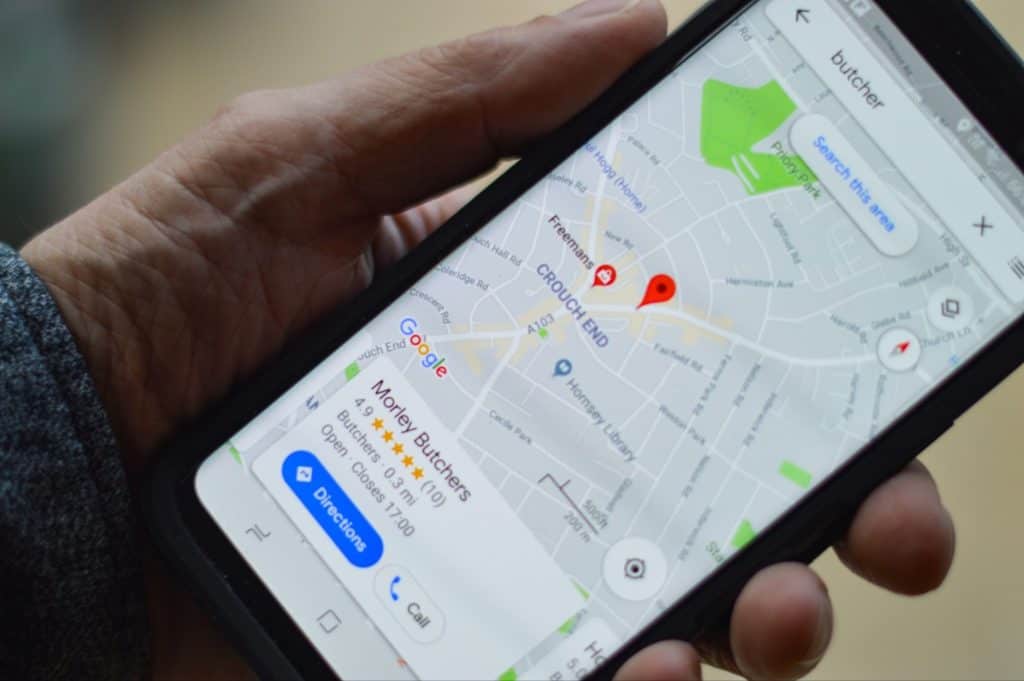
Digital map data collectors such as Google Maps use aerial photography and satellite imagery to create their maps. This has the benefit that it doesn’t involve any physical contact with the Earth or carbon emissions from motors, but the disadvantage is that if the imagery is taken from an airplane, then it may involve high-altitude flights and therefore higher carbon emissions.
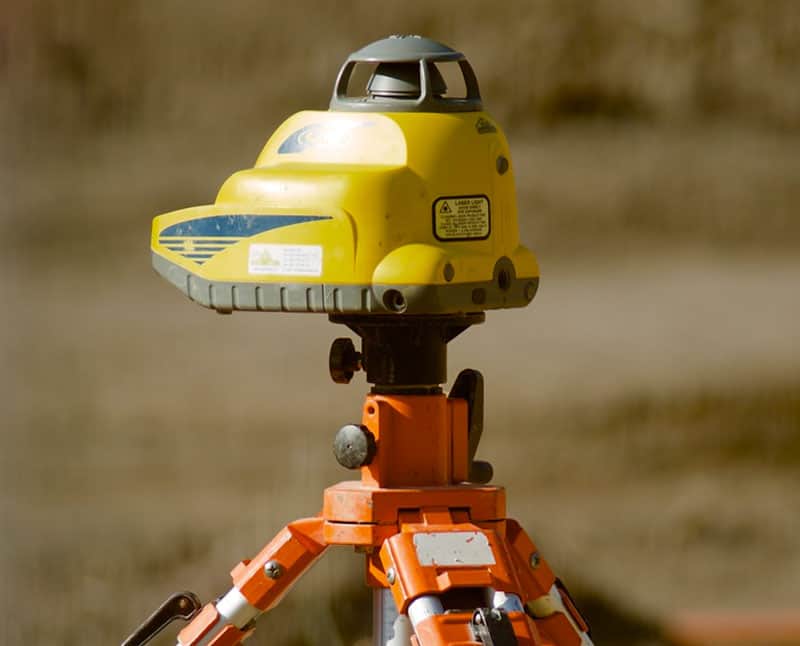
2. Surveyors in the field
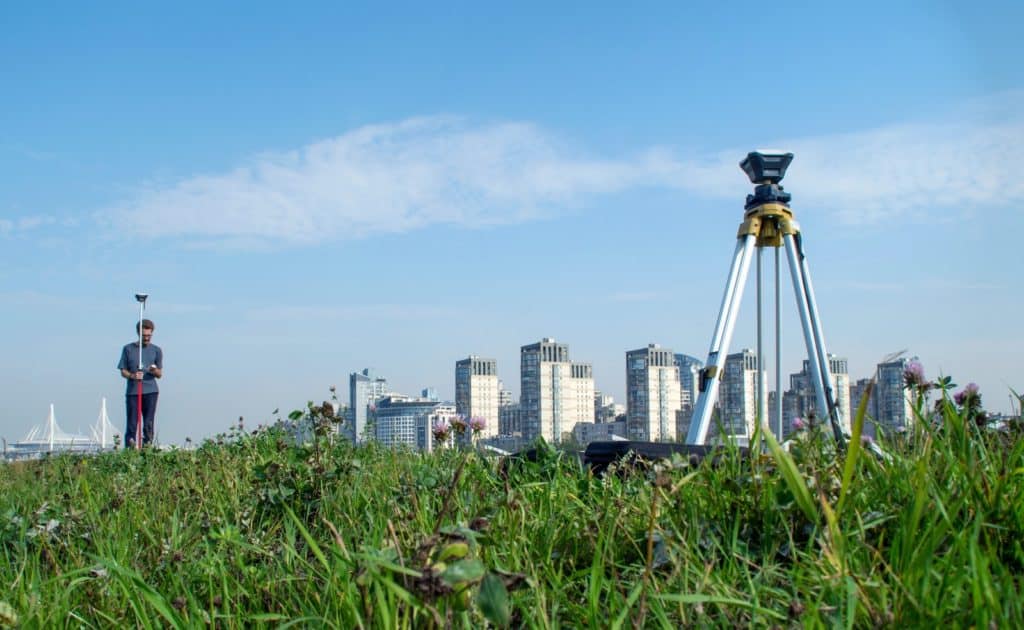
Surveyors who collect data by going out into the field and measuring things like land area and elevation are using techniques such as total stations and theodolites. They can carry out their work anywhere in the world (huge advantage), but come with environmental costs of physical contact with the earth and motorized transport.
3. GIS professionals
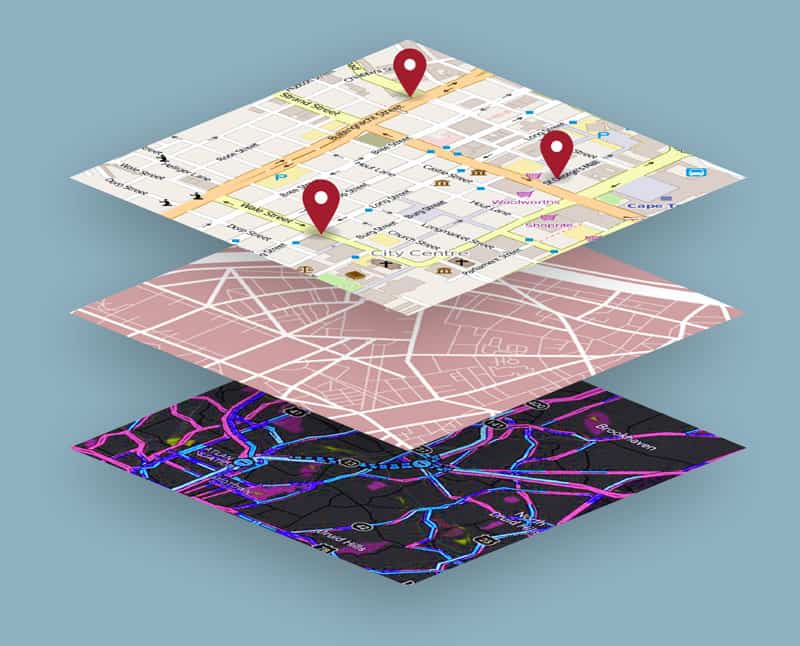
GIS professionals who work with digital maps that have been created from a variety of data sources use the same methods as surveyors in order to collect their data, but also make use of aerial imagery and satellite imagery when it comes to the map rendering process. In addition, they must go through various stages to ensure that their finished product is accurate, and they usually need to use GIS software in order to view different map layers.
Carbon footprint sources
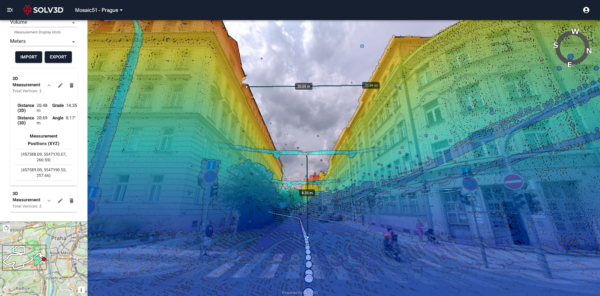
Knowing the three types of methods, the carbon footprint related to mobile mapping can be further divided into three main sources: Projecting Digital Terrain Models (DTM) onto vehicles, capturing imagery for Digital Surface Models (DSM), and the operation of navigation systems in vehicles. Let’s explore each of their advantages and disadvantages.
Projecting DTM onto vehicles
The projection process is characterized by high amounts of energy consumption because it takes place outdoors under conditions that are often windy, cold, or hot. Large amounts of energy are also needed to operate light sources to illuminate the target during projection.
Capture of DSM and other Imagery
The generation of Digital Surface Models (DSM) and other imagery, such as Orthophotos, requires sophisticated sensors, e.g., laser scanners or digital cameras, which usually have high power consumption. During data capture, mobile mapping vehicles often need to drive for extended periods in order to reach optimal positions against the target.
Operation of navigation systems in vehicles
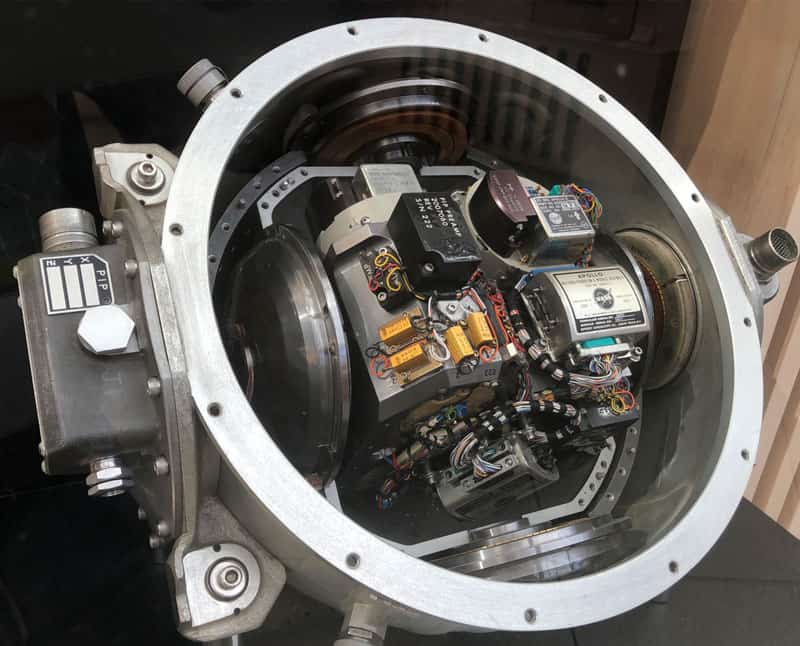
The energy consumption of navigation systems depends on the number of satellites available and how frequently they are used. More precisely, we can distinguish between three main types:
- Inertial navigational aids, which rely on dead reckoning and require a gyroscope,
- GPS, which requires at least 24 satellites to function properly, and
- Glonass, which requires 30 satellites.
The type of system used can be determined using the Satellite position indicator in their smartphone or navigation unit.
The carbon footprint of different data collecting methods
Now, let’s compare specific data collection methods and their carbon footprint.
GPS devices
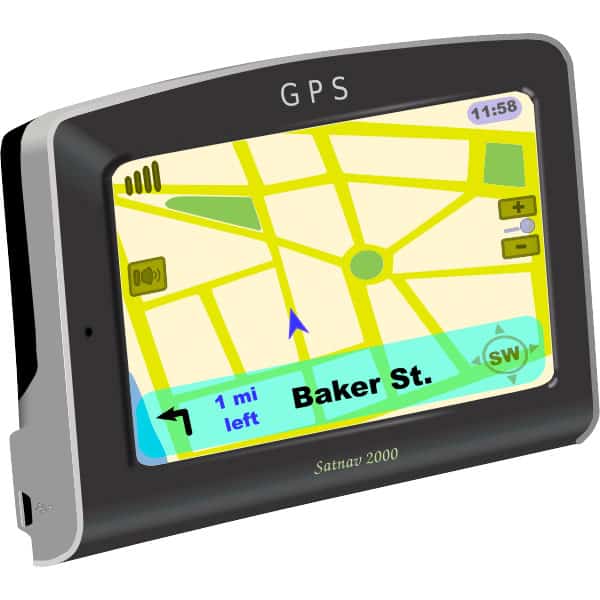
GPS devices are an increasingly popular method of collecting mapping data. They work by measuring signals between a device and satellites, which can be used to determine information about the environment around it. The amount of energy required to collect this type of data is fairly small in comparison to other collection methods, and the benefits far exceed the disadvantages. GPS brings a new level of efficiency while saving on unnecessary idling and cutting down on wasteful resources.
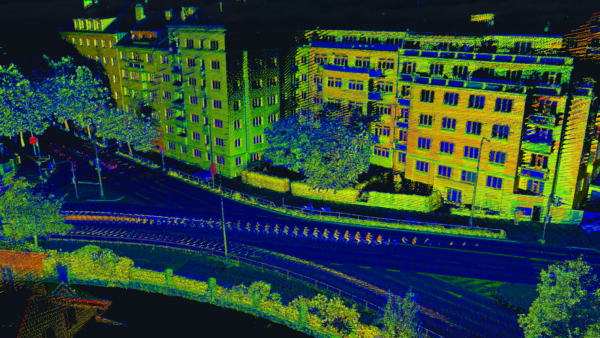
Lidar
LiDAR stands for light detection and ranging, which uses laser beams to measure distances between objects. Since its inception, LiDAR methods have undergone many technological improvements and can now collect data in complex environments with ease. Not only that, it is known to be one of the most accurate ways to collect data. It requires heavy equipment that can emit quite a substantial amount of carbon dioxide, making it one of the most carbon-intensive mapping methods.
Drone
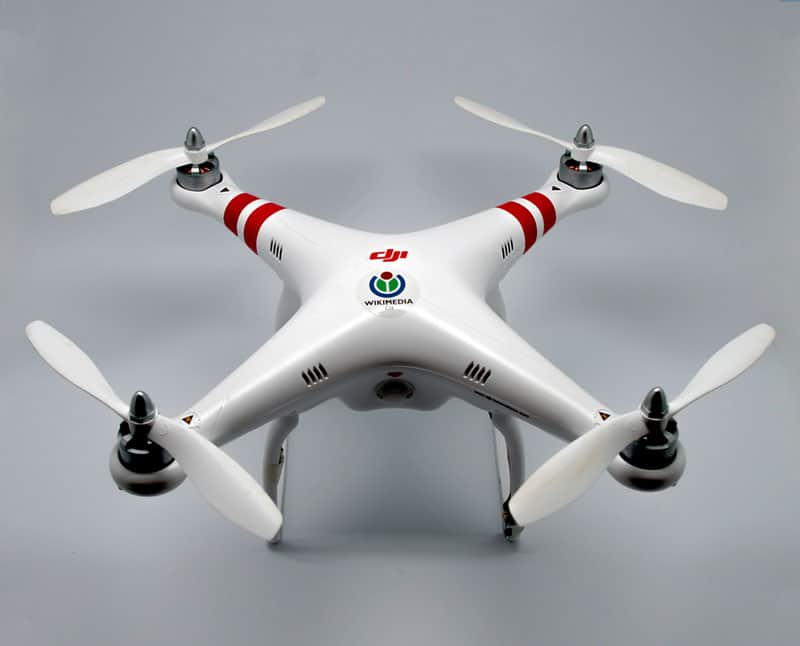
In order to collect information for a physical map or monitor specific data (e.g., the status of endangered species), drones are sent out with special cameras attached to them. They get aerial shots of various locations or details about objects from specific perspectives. Drones consume far less energy than on-the-road vehicles and could potentially halve carbon emissions in the logistics industry.
Satellite data
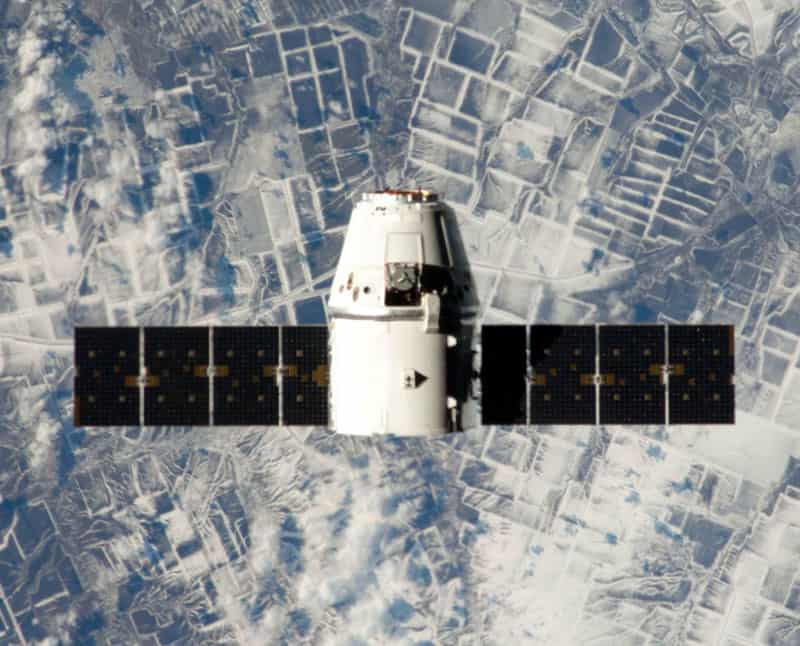
Satellite data is often used as a supplement to other digital maps because it’s useful for providing context, especially in dense urban areas or for covering large areas at once. Though this data collection method definitely emits more carbon dioxide than others, it saves on efficiency of the process and also helps to monitor emissions with its advantages, such as high resolution and availability.
IMU
An inertial measurement unit (IMU) uses internal sensors to collect information about the direction and speed at which a device is moving. While IMUs are light devices and so don’t generate very much carbon dioxide (but still more than GPS), they may require many other components in order to operate, while also emitting some heat, which can lead to more energy being used at a faster rate than collected.
How can we make mobile mapping (even) more sustainable
As with any technology-driven endeavor, it inevitably comes with a price. In the case of mobile mapping, there is one main factor that has to be considered and improved: carbon emissions from vehicle use.
There are a few ways that this can become sustainable in terms of its carbon footprint. One way is to use alternative energy sources such as solar or wind power to charge the devices used in the mapping process. Another way is to use data compression techniques to reduce the amount of information that needs to be transmitted and stored. We can also develop more efficient algorithms and software for mobile mapping that consume less processing power or shift patterns of mobile mapping activities to specific times of the year. Read on for more details on each one.
Alternative energy sources
In its most basic form, mobile mapping involves a mobile device collecting data from the surroundings and sending it to a central computer, where it is stored. In order for this process to happen without interruption, the mobile device must be constantly powered – either by an external power source or its own battery. This can be problematic if access to electricity or battery charging facilities is limited.
One way to alleviate this problem is to use alternative energy sources, such as solar power or wind power, to charge the devices used in the mapping process. Solutions are already out there, for example: Ford’s model that runs primarily on solar power from panels on its roof, micro wind turbines for charging small (mobile) devices, and perhaps one of the most recent and prominent inventions on the rise: solar-powered drones.
Data compression techniques
Another way to make mobile mapping more energy efficient is to use data compression techniques to reduce the amount of information that needs to be transmitted and stored. For example, the USGS is already accessing LiDAR data in its own LAZ compressed format file, while research by K. Kohira and H. Masuda proposed a new point-cloud compression method for vehicle-based mobile mapping systems. Point-clouds are mapped onto 2D pixels using GPS time and the parameters of the laser scanner. Then, the images are encoded in the Portable Network Graphics (PNG) format and compressed using the PNG algorithm, without deteriorating the image quality.
Mobile mapping software
We can develop more efficient algorithms and software for mobile mapping that consume less processing power, such as real-time dense surface mapping and tracking systems, upgraded concepts in the robotic industry, and sensor improvements for digital electronic components (more info here). Developments like this will make it easier to develop mobile mapping systems that require less time and energy to compute.
Shifting patterns of mobile mapping activities
As the overall environmental impact of mobile mapping activities depends on where and how they are performed, it’s important for organizations that are involved to adopt practices that reduce carbon emissions by shifting patterns of activities at certain times of year.
Some of them are more carbon-intensive than others. For example, collecting Digital Surface Models (DSM) is generally less emission-intensive than projecting Digital Terrain Models (DTM). Furthermore, emissions related to mobile mapping are often greater during colder months due to the use of light sources and higher power consumption in general.

Best low-carbon footprint alternatives
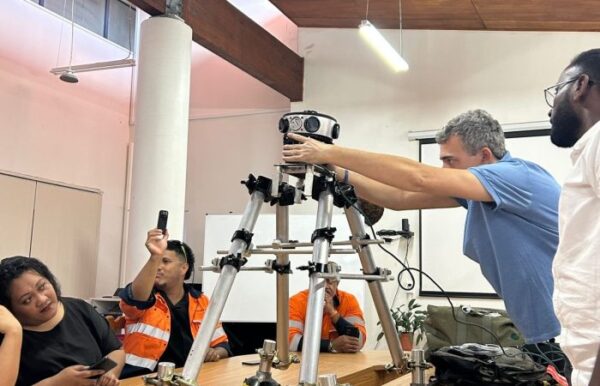
Most mobile mapping systems are very large, heavy, and require an entire system within the vehicle. The system usually has a workstation, computer, and 1-2 people to operate.
If we want to create maps more sustainably, we need to use simpler and less complex mapping methods. By doing so, we can ensure that our carbon footprint is as small as possible. This helps cities in their fight for a cleaner and more sustainable future. So, what if, instead of manually entering all the information, you could get it directly from the source?
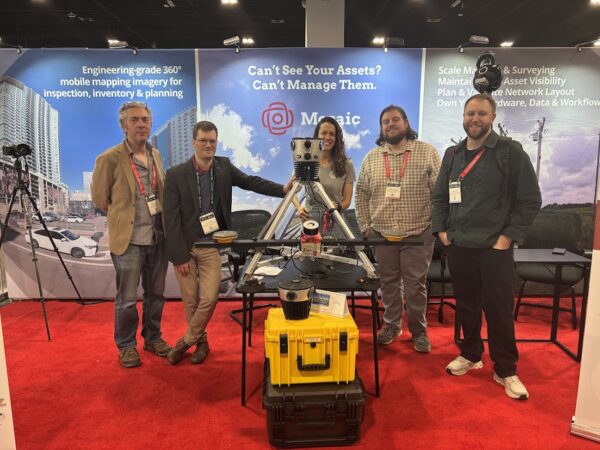
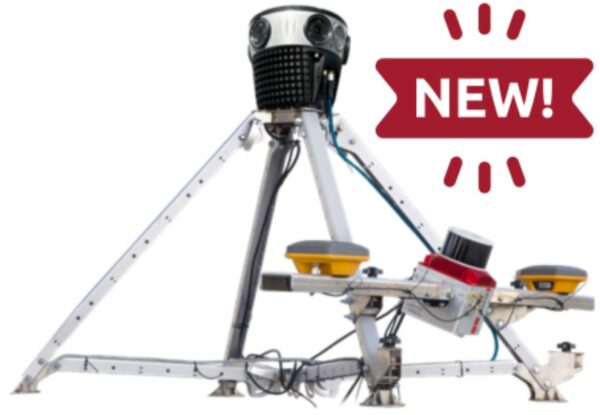
Currently, the most widely used alternative method for citywide data collection is garbage trucks. They collect information from every citizen, multiple times a week, and often cover massive geographical areas. In certain cities, such as Barcelona, they even go into every alley to take every citizen’s waste. The only thing needed to make this data accessible is open-source software. It acts as a bridge between these visits and the GIS, such as that used on these cameras. A robust, all-in-one solution like Mosaic’s M51 is amazing for urban mapping in all weather conditions. It is even light enough to go on a bike!
Trams and trains are also great mobile mapping alternatives. They have the added benefit of using renewable energy sources like wind or solar power. Check it out here.
Limitations of low-carbon alternatives
Although working with the existing city infrastructure is innovative, effective, and straightforward to implement, there are obstacles to consider.
A list of things that sometimes prevent the usage of mobile devices in public transport:
- Limited resources (battery, memory, CPU),
- GPS readings have limitations to a certain range,
- The rise of “unintended” data collection. This can happen because of software or hardware bugs, or a lack of understanding of how the system works,
- Using only registered devices.
Certainly, with every year, tremendous technological advances happen. Using public transport for data collection is a promising approach to a more sustainable mobile mapping future.

Is the future colored green?
The future of sustainability in mobile mapping and cartography is an exciting prospect. We are on the verge of a revolution in this field. We just need new technological improvements and a growing awareness of the importance of environmental preservation.
However, with the increase in urbanization worldwide, we must consider how our mapping practices impact the environment. This is especially true for cities where most of the global carbon emissions are coming from. To achieve sustainability, we must consider all aspects of the mobile mapping process, from data acquisition to data processing. Reducing our carbon footprint is a very important consideration, and it’s up to us to reduce it where we can.
Mosaic offers innovative solutions that are pushing the boundaries of mapping freedom and exploring new, green ways of data collection.
P.S. How does your city rank in mobile mapping? Let us know!