")
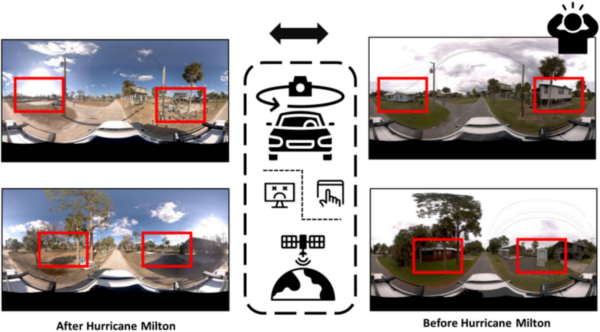
Natural disasters are prevalent worldwide, and the post-storm management needs to be as efficient as possible for communities to recover fast.
Assessing the Damage Post Disaster
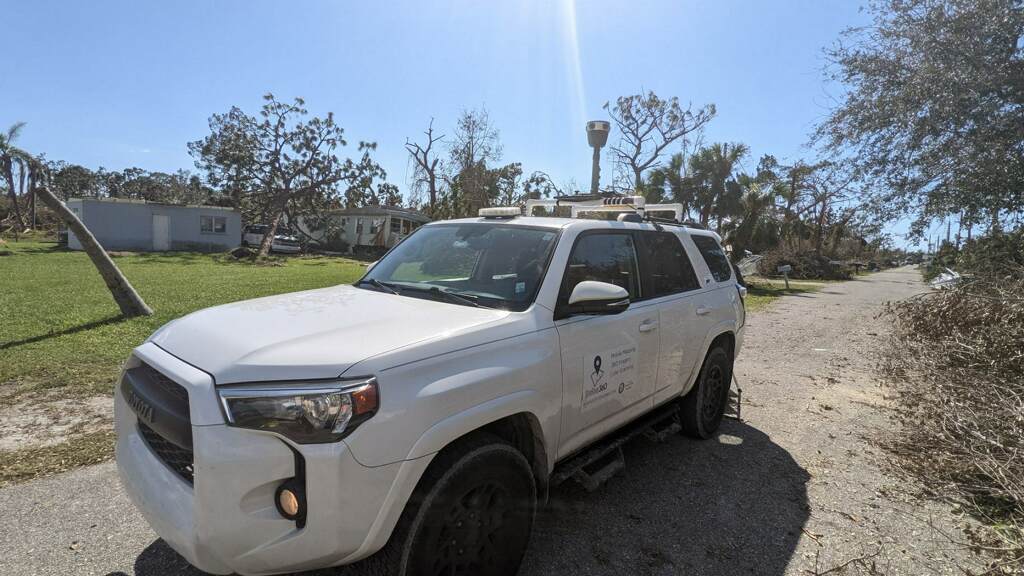
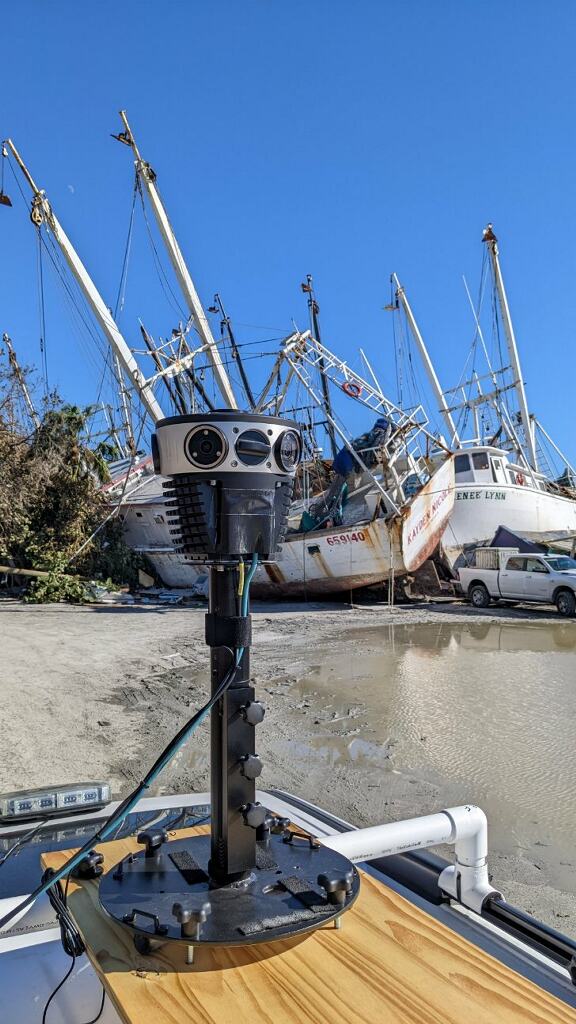
Learn how one of Mosaic’s 360º mobile mapping cameras, the Mosaic 51 has been helping with post-storm management. The Mosaic 51 is in Florida collecting street-level data on the aftermath of Hurricane Ian.
With your camera, the removable hard drive, and the simplified workflow, we’ve gotten to where we can basically have stuff live within 24 hours. We couldn’t do that before switching to Mosaic.
Mike Vorce, President Site Tour 360
Learn how Vorce and Site Tour 360 successfully capture street-view data and visualized it within 24 hours to help local agencies and communities recover quickly from Hurricane Ian.
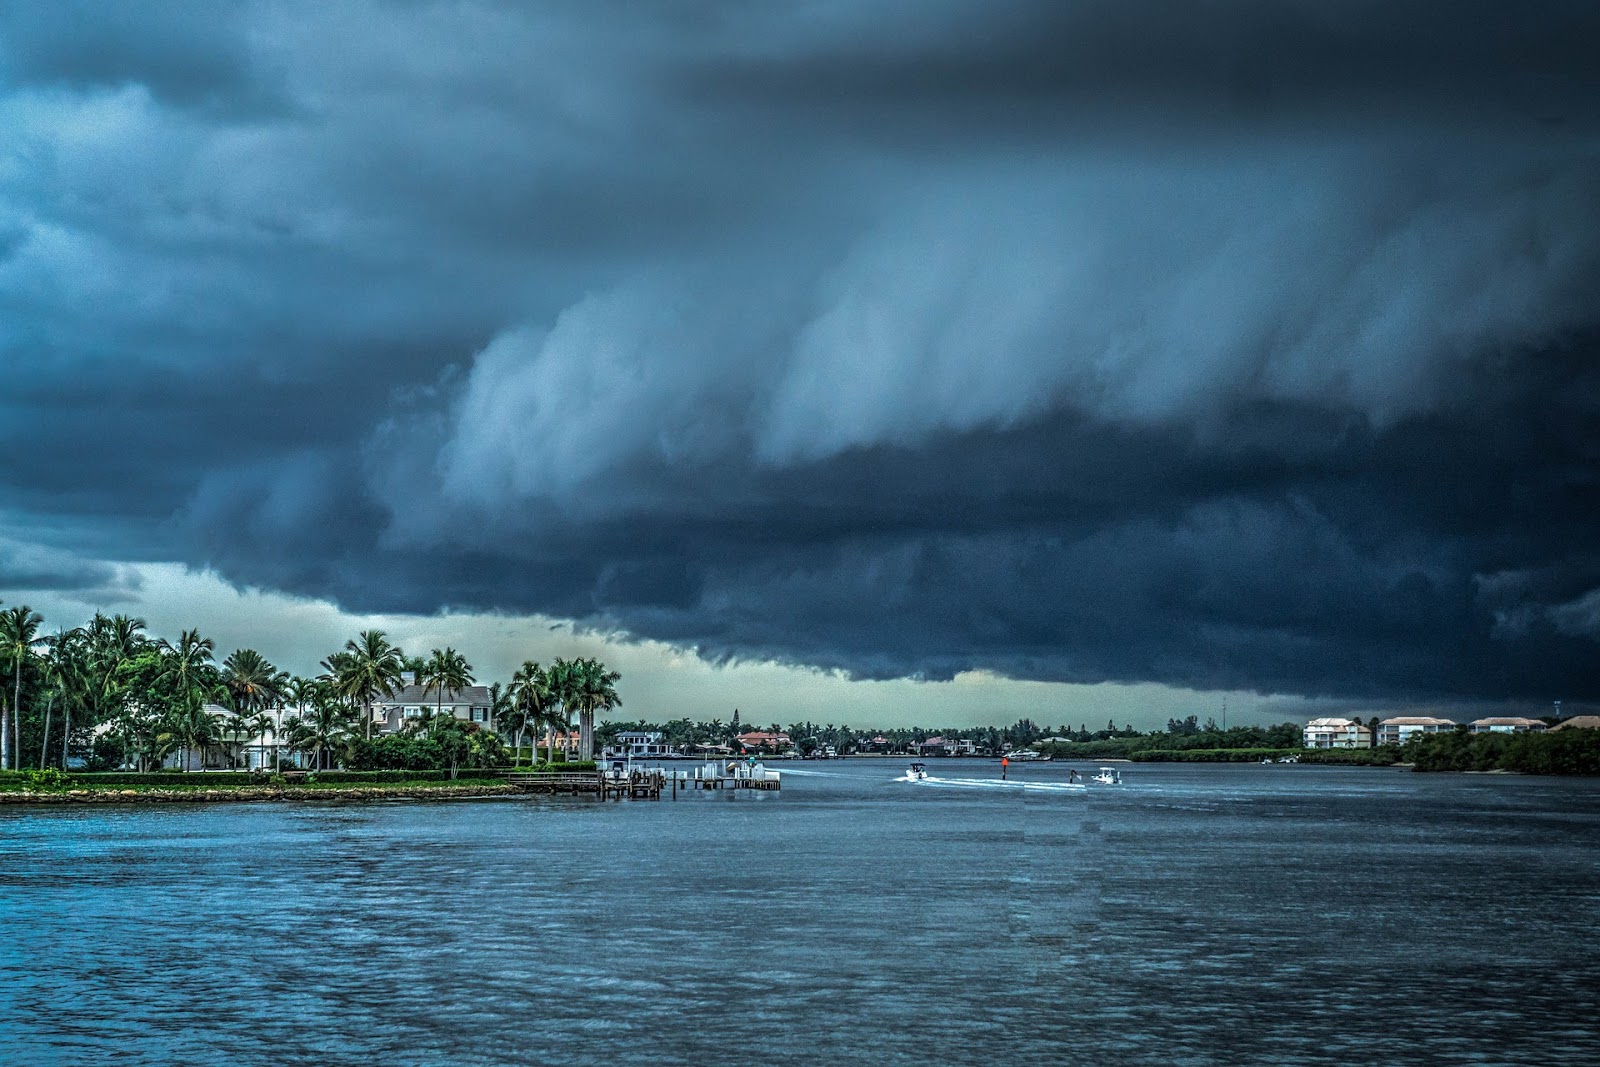
Hurricane Ian hit Florida on 28th September this year.
It is the deadliest hurricane to have hit Florida since 1935. A highly destructive category 4 disaster, Hurricane Ian has claimed over 100 lives. It caused widespread damage across western Cuba and the southeast US. The storm hit Florida and South Carolina particularly hard.
Extreme rainfall caused major flooding resulting in cleanup operations that could last for months, the scale of which is enormous.
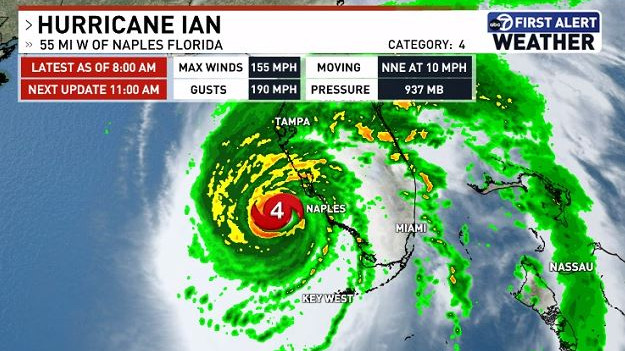
‘On October 11, the National Oceanic and Atmospheric Administration stated total losses would be more than $50 billion, likely making Ian the costliest hurricane in Florida’s history.’
A whole host of precautions are in place for when disaster strikes. There is prior planning, emergency services during and post-disaster clear up and prevention.
Governments need to work fast to rescue people. Affected energy lines need to be restored and housing to be made available for those that have lost it.
Now people were very surprised at how quickly we were capturing, processing, and publishing the data. All the imagery that we collected was published by basically the next morning,
Dylan Faraone, Technical Director at Site Tour 360
We also have to keep in mind these other responsibilities:
- Search and rescue
- Debris removal
- Environmental risk analysis
- Damage assessment
- Rebuilding processes
Here we discuss how and why collecting accurate and high-quality data is so important in post-storm management and recovery.

Historical Data Collection and Comparison
Capturing data in the aftermath of events such as Hurricane Ian is critical for disaster management – and vital to the rescue efforts. These kinds of natural disasters are not preventable, but data helps people before and after it takes place.
Professionals monitor local data collected on housing, roads, and all infrastructure, yearly for changes and upgrades. This historical information is highly valuable in post-storm assessment for comparison to the present conditions of this infrastructure.

These measures are in place to help communities recover as quickly as possible post-storm, and therefore having a fast and efficient method of collecting data is imperative.
District governments and municipalities, real estate agents, insurance companies and a wide range of private companies need this data for risk and damage assessment. They can then also find the best way to prepare against potential future issues and process insurance claims.
When speaking on how organizations such as NOAA and FEMA in the United States can take advantage of real-time street level images post disaster:
It’s usefulness was a very clear for planning purposes and deploying resources to that area.
We knew where to put our teams based on water height and road conditions. It was a way for them to very quickly see the condition and determine if we needed to physically send people to this place, or if we can cross it off the list. For planning on the day-to-day, the data was very helpful for them.’
Dylan Faraone
Geographic information systems (GIS) can view historical and current maps and road views side by side, comparing data pre and post-disaster. This helps rescue teams visualize the full situation and the organize the disaster response process.

Capturing Data for Road Asset Monitoring
Once the storm has taken place the danger is not over. Flooding and landslides are common after a storm, and if the direct damage from a hurricane was not already enough for infrastructure to handle, these additional problems will strain them further.
It is important to gauge the structural integrity over time, so monitoring buildings based on historical data is crucial . In standard road asset monitoring, surveyors regularly collect information on:
- Road Infrastructure – road network, road surfaces, road signs, street lighting, barriers, pedestrian pathways, cycle paths, drains
- Private Non-road Assets – electricity lines, water and gas pipelines, telecommunication services
- Environmental Assets – trees and shrubbery, grass, wildlife habitat
This allows governments to stay on top of maintenance and ensures their city is in good health. In the case of an unprecedented natural disaster – it helps vastly to have a set procedure in place to build upon.
A standard road and road asset maintenance program follows the same formula:
- Knowledge of existing assets
- Monitoring and collection of data
- Assessment of data
- Financing and planning
- Implementation of repairs and/or replacements
This is important for community management post-storm.
Post-Storm Management Insurance Claims
Insurance providers are inundated with claims that they need to investigate. Insurers have predicted the below:
‘Hurricane Ian is estimated to have caused insured losses of up to $57 billion to $63 billion’
Verisk Extreme Event Solutions and Karen Clark & Co
Hurricane Ian will be problematic for insurers due to the big issues with flooding in the coastal area. The damaged property, storm surge, wind and inland flooding are all measured to calculate which damage will indeed be covered.

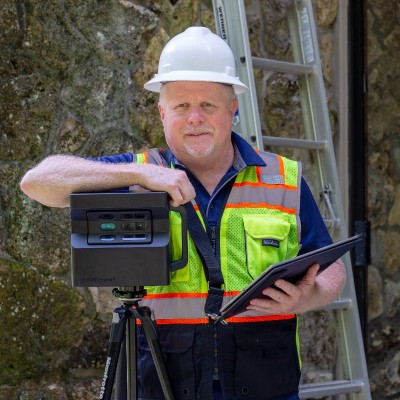
Field inspectors regularly use 360° cameras to document property claims.
‘Sharing reports with adjusters and carriers within hours of leaving a site assists in communicating the extent of a claim as quickly and with as much detail as possible.’
JS Held
The usage of high-tech 360° equipment in post-storm management enabled those deployed to respond to such disasters to document the sites quickly and accurately.
This results in a faster estimate delivery for the client, and for individuals to start rebuilding their lives.
360° Vision to Assess the Post-Storm Damage
Aerial imagery taken in the aftermath of a storm helps the emergency services and local governments to provide resources where they are most needed. Aerial vehicles capture data effectively, and can certainly capture data that cannot be collected from the road. However, there can be limitations, especially when it comes to close-up detail quality.
Collecting imagery with a 360° camera, which incorporates GPS and processes the data is the perfect combination in time-sensitive situations such as these.

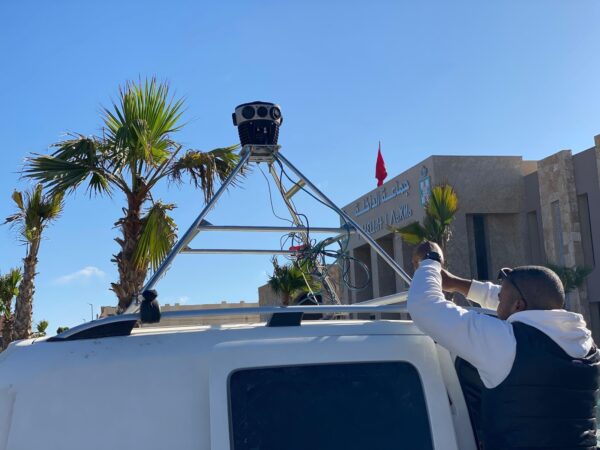
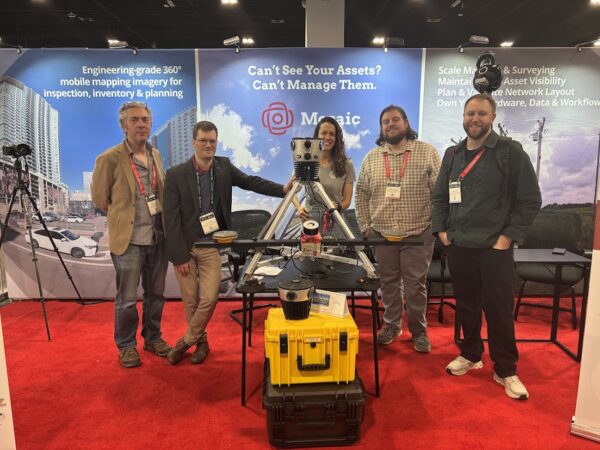
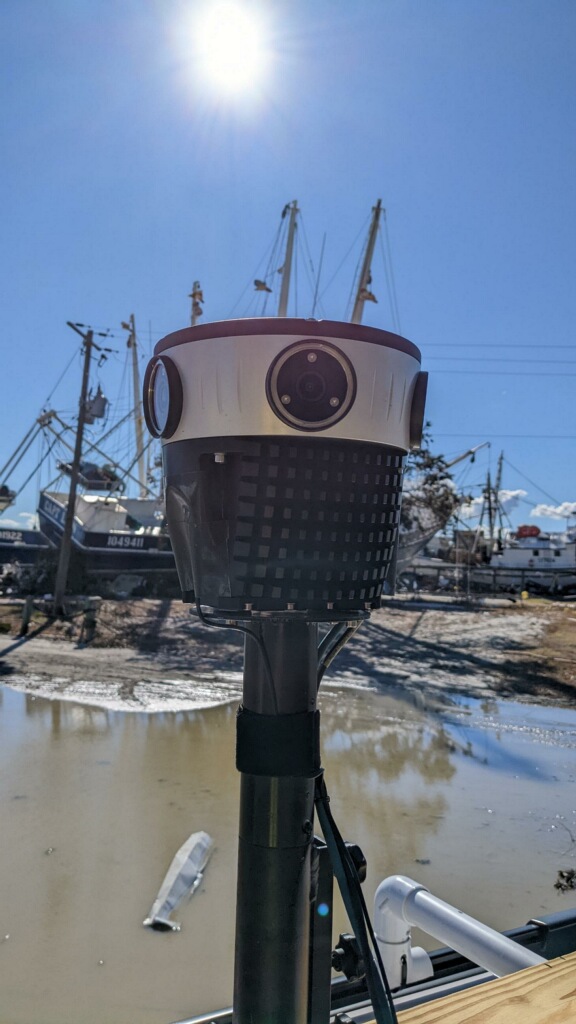
Our Mosaic51 camera is a robust, high-resolution 360° camera.
Our Features
12.3K Resolution Camera
Six high-resolution lenses photograph streets in 360° vision. The quality of the lens can pick up detail at a distance and is much sharper than spotting issues with the naked eye.
Purpose Built
A comprehensive system that encompasses GPS and data storage, without the need for any additional workstation.
Rugged
A robust frame and connectors withstand the harshest of environments. From searing heat to freezing temperatures, this system is waterproof, dust resistant and capable of taking on the most rugged of terrains.
Single Manned Operation
This unit is easily manned by one person and is affixed to the roof of a car. It is lightweight to move and straightforward to use with minimal training required.
Time Efficient
Accurate and high-quality data is captured the first time, which is vital in post-storm management. This ensures no need for repeated visits to sites, wasting valuable time.
Streamlined Service
A combination of these features provides a fast and efficient system with excellent results, allowing those using it to make better-informed decisions, and can react faster to help those in need. Non-vendor-locked data formats mean the Mosaic 51 integrates seamlessly into existing systems.
Global Positioning System
This camera has a highly accurate built-in GPS, in combination with the auxiliary port, which can then be connected to many other types of sensors for accuracy to the centimeter.
Mosaic 51 – A review
Our Mosaic 51 camera system was recently used to collect data in the aftermath of Hurricane Ian:
As part of its ongoing work with the National Disaster Preparedness Training Center, FEMA and the University of Hawaii, Site Tour 360 deployed its newly purchased Mosaic 51 camera to the scene immediately. The Mosaic 51 performed quite well while collecting over 400 miles of 360° imagery in very harsh conditions!
Mike Vorce, President, Site Tour 360
By simply driving a vehicle mounted with this equipment, the data was collected quickly and efficiently.
The Importance of Georeferencing
Each of the listed features above is important in the processing of data.
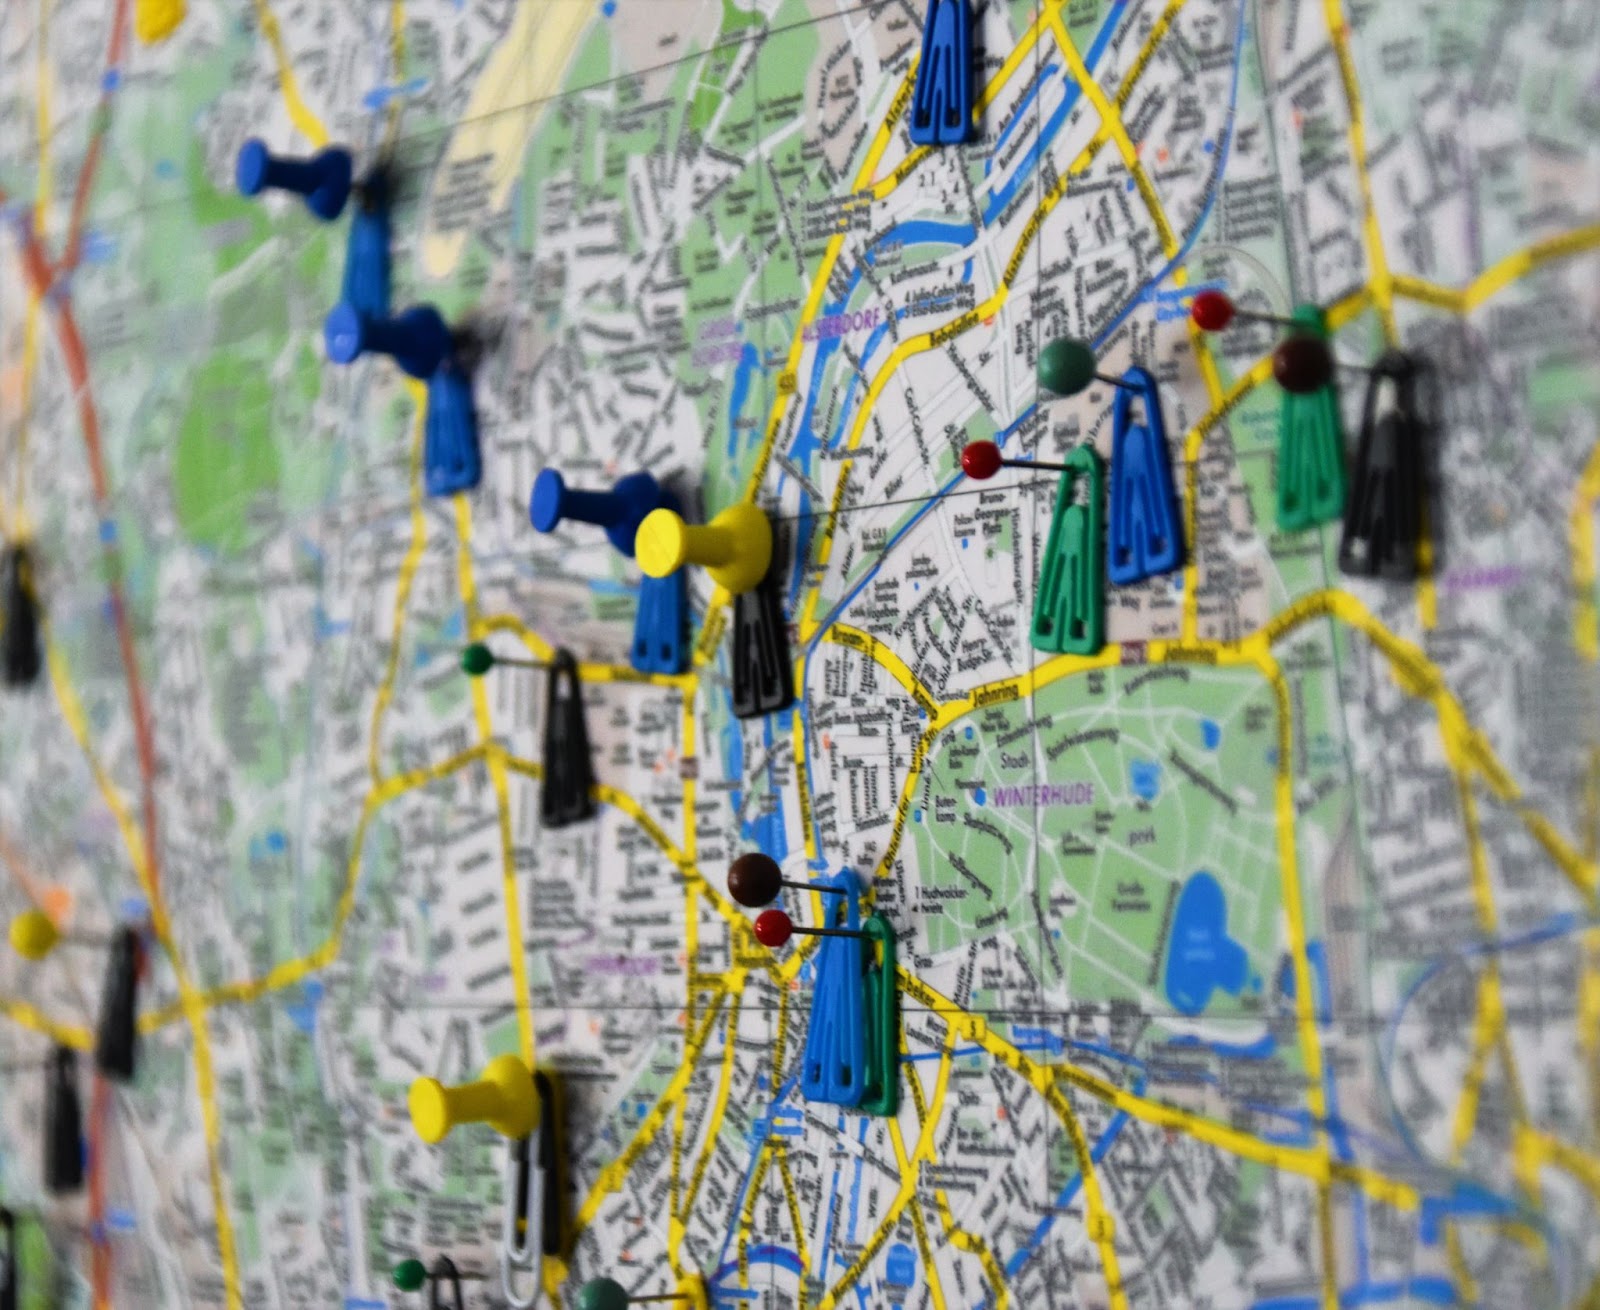
Knowing exactly where the affected site is, and having a reliable system to provide this, is just as crucial. Having accurate and up-to-date GIS data ensures rescue services can make informed decisions and take action.
A geographic information system (GIS) is a system that creates, manages, analyzes, and maps all types of data. GIS connects data to a map, integrating location data with all types of descriptive information.
ESRI
GIS essentially ‘surveys’ the land and measures location and distance. It is a layered map, and within each layer, information is presented. Subsequently, these ‘layers’ can be removed or added by the user to determine how much data of a certain location they can access and assess.
To learn more about GIS software and the technology needed to supply the data, check out this article here.
The user, for example, government agencies or construction companies, can then work with data relating to all manner of infrastructure:
- Buildings
- Roads
- Railways
- Tunnels
- Bridges
- Water and energy supply lines
GIS is a highly advantageous and useful tool, and it has the potential to provide so much more.
Advanced technologies such as Artificial Intelligence can be applied to expand further to gain more understanding of how our networks and systems function and how they can be improved.
Structural Analysis
Structural analysis is imperative in the identification of an infrastructure’s potential weak points.
Prior planned preventative measures that were put in place are analyzed to see if they were able to effectively withstand what nature threw at them. Infrastructure needs to be examined to see if predictions made prior to a natural disaster did indeed hold up.
Mosaic users work with multiple companies that study natural disasters and the effects that they have on infrastructure:
- Debris Management courses
- Wind and surge event analysis
- Companies gauging storm impact
360° vision is not only crucial to rebuild but also to gauge damage impact.
Minimising Post-Storm Damage: Virtual Impact Analysis
Natural disasters cannot be entirely prevented but we can work on how to minimize their damage. However, it’s not the best practice to wait until a real-life occasion to examine the results, so an AI-assisted representation of a building or city is a much safer alternative.
A digital twin is a virtual representation of a system or process – a virtual model that reflects a physical form. Digital twins allow companies and planners to test out potential disastrous effects on a building or system before it happens in the real world.
Available in real-time, a digital twin is an upgraded simulation used for testing, monitoring, and maintenance.
More detailed information on the concept and actualisation of digital twins can be read here.
Using this technology accordingly, analysts can compare field data with a virtual model, and make improvements in the model to strengthen infrastructure in real life.
Conclusion
In the early 1900’s we didn’t have the technology to warn us of a natural disaster striking. Presently with the modern scientific advancements we have made in recent years, meteorologists help us by predicting storms days in advance.
Using this knowledge, quicker and more efficient communication and with technology relaying information enables us to be much more prepared when dealing with circumstances beyond our control.
We can hope that after the natural disasters we faced in the past, we can at least minimize the damage, and strengthen communities in post-storm management to handle the weather the world presents us with.